Geoscience Reference
In-Depth Information
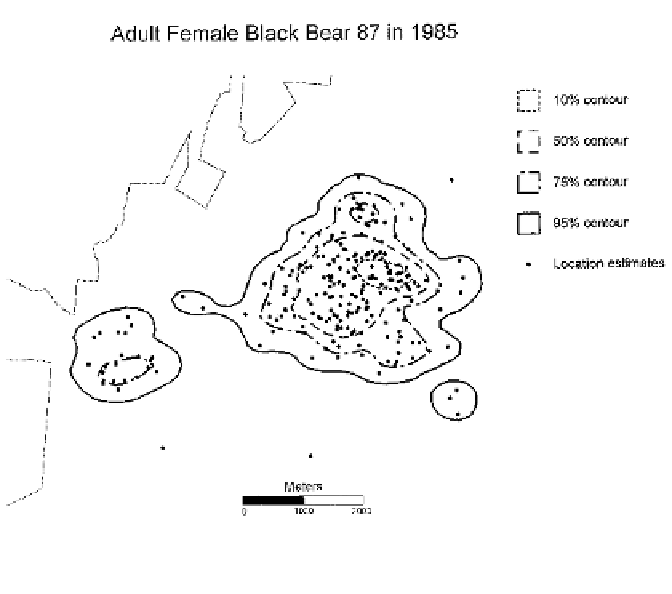
Figure 3.2
Location estimates (circles) and contours for the probability density function for adult
female black bear 87 studied in 1985. The lightly dotted black line marks the study area border.
repeatable probability level; the smallest area with a probability of use equal to
0.95 is defined as an animal's home range. No strong biological logic supports
the choice of 0.95 except that one assumes that exploratory behavior would be
excluded by using this probability level; to my knowledge, this assumption has
never been tested. An alternative approach is to exclude from consideration the
5 percent of the locations for an animal that lie furthest from all others. Elim-
inating these locations might also eliminate occasional sallies. A strong statis-
tical argument exists for excluding some small percentage of the location data,
the utility distribution, or both; extremes are not reliable and tend not to be
repeatable. However, this argument does not specify that precisely 5 percent
should be excluded. Using 95 percent home ranges may be widely accepted
because it appears consistent with the use of 0.05 as the (also) arbitrary choice
for the limiting
p
-value for judging statistical significance.
Once home range has been defined as a utility distribution, a reliable
method must be sought to estimate the distribution. Estimating utility distri-
butions has been problematic because the distributions are two- or three-
dimensional, observed utility distributions rarely conform to parametric mod-