Geoscience Reference
In-Depth Information
Brazil
South Africa
Canada
Mexico
Malaysia
Russia
Argenti
Switzerland
Venezuela
United States
United States
India
Spain
Switzerland
Brazil
Australia
India
Pakistan
Russia
Austria
Pakistan
Mexico
Australia
Canada
Germany
Germany
Belgium
Austria
Czechoslovakia
Spain
Belgium
Malaysia
Venezuela
South Africa
Czechoslovakia
0
10
20
30
40
0
2 4
Interregional Redistribution
6
Decentralization of Interpersonal Redistribution
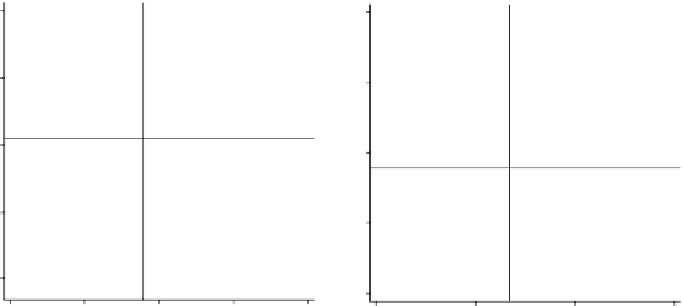
FIGURE 1.1. Fiscal Structures and Income Inequality in Political Unions
right panel ranks countries along the two dimensions of fiscal structures identi-
fied previously, namely, interpersonal and interregional redistribution.
14
Thus,
the y axis ranks countries along the same indicator of decentralization of inter-
personal redistribution (x axis in the previous panel), and the x axis now ranks
unions according to their level of interregional redistribution.
Two important points follow from the left panel in
Figure 1.1
. First, the
United States, the case on which the conventional view is largely based, is indeed
the most prominent example of a positive association between fiscal decentral-
ization and income inequality. Yet it clearly seems to be more the exception
than the rule, particularly among advanced industrial political unions. Canada,
Belgium, Germany, Austria, and Spain offer a wide range of variation in both
distributive outcomes and levels of decentralization of interpersonal redistribu-
tion.
15
Moreover, the variation becomes even larger if developing federations
are considered.
This diversity of outcomes, largely at odds with the conventional view,
motivates the leading question in this study: why is it that some political unions
show less redistribution and more inequality than others? The key, I argue, lies
in the organization of their fiscal structures. A comparison between the two
panels in
Figure 1.1
illustrates this point. The top left quadrant of the left panel
includes a group of countries (Venezuela, Malaysia, South Africa, Mexico, and
Brazil) with exceedingly high levels of inequality and very little decentralization
of interpersonal redistribution. Interestingly, this subgroup also shows very low
levels of interregional redistribution as reflected by their concentration in the
bottom left quadrant of the right panel.
14
Interregional distribution is defined as transfers to other levels of government as a percentage
of GDP. For additional details on sources, see Appendix D.
15
See also Lindert (
2004
); Linz and Stepan (
2000
); Obinger, Leibfried and Castles (
2005
).