Geoscience Reference
In-Depth Information
1600.00
1400.00
1200.00
1000.00
800.00
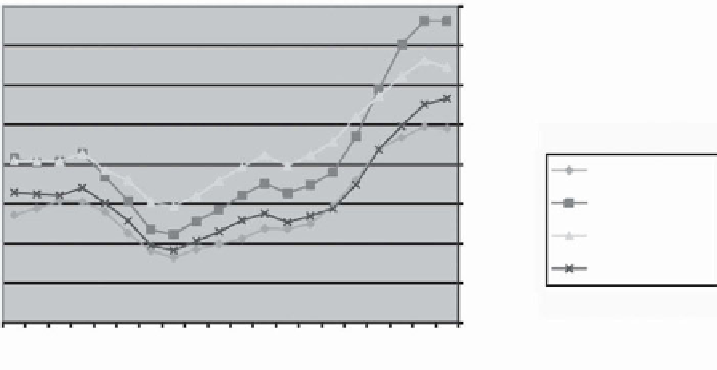
CANGNPPCMP
600.00
USAGNPPCMP
USAGNPPC1929PR
400.00
USADISINCPCMP
200.00
0.00
Years
FIGURE 5.1. Evolution of GNP per capita in Canada and the United States (1926-1945)
If the status quo in terms of the preexisting policy and effective veto power
of subnational units were similarly biased toward states and provinces, why did
the paths of these two systems diverge between the late 1930s and early 40s?
Does the answer perhaps lie in the different impact of the Great Depression as
an exogenous shock to each of these political economies?
This does not appear to be the case. Canada and the United States were hit
similarly by the sequence of economic downturns that reached its peak during
the late 1920s and early 30s. Briefly mentioned, these were four: an ongoing
process of deruralization that created a massive surplus in the Canadian and
American labor forces, the European monetary crisis (1930-1931), an insuffi-
cient and late reaction in terms of macroeconomic policy, and, finally and most
visibly, the worldwide collapse of financial and stock markets. Together these
four factors provoked a long lasting reduction in wealth and consumption,
which, in turn, affected expectations about the recovery, making the Depres-
sion longer (Temin
1976
: 62-96, 138-179). The social consequences of the
Depression were dramatic on both sides of the border (Epstein
1936
).
Figures 5.1
and
5.2
display the magnitude as well as the timing of the
Depression through two indicators: the GNP per capita
3
, and the percentage
of the total civilian labor force that is “not working and seeking a job.”
4
3
These are the Gross National Product per capita at market prices, the Gross National Product
at 1929 prices and the Disposable Income per capita at market prices. Source: see previous
footnote). Canada: Historical Statistics and represent Gross National Product at Market Prices.
4
Sources: Canada: Historical Statistics. United States: The unemployment rate is defined as one
minus the proportion of the civilian labor force that is actually employed (Historical Statistics of
the United States. Colonial Times to 1957, US Department of Commerce, Bureau of the Census,
1961, pp. 68-69).