Geoscience Reference
In-Depth Information
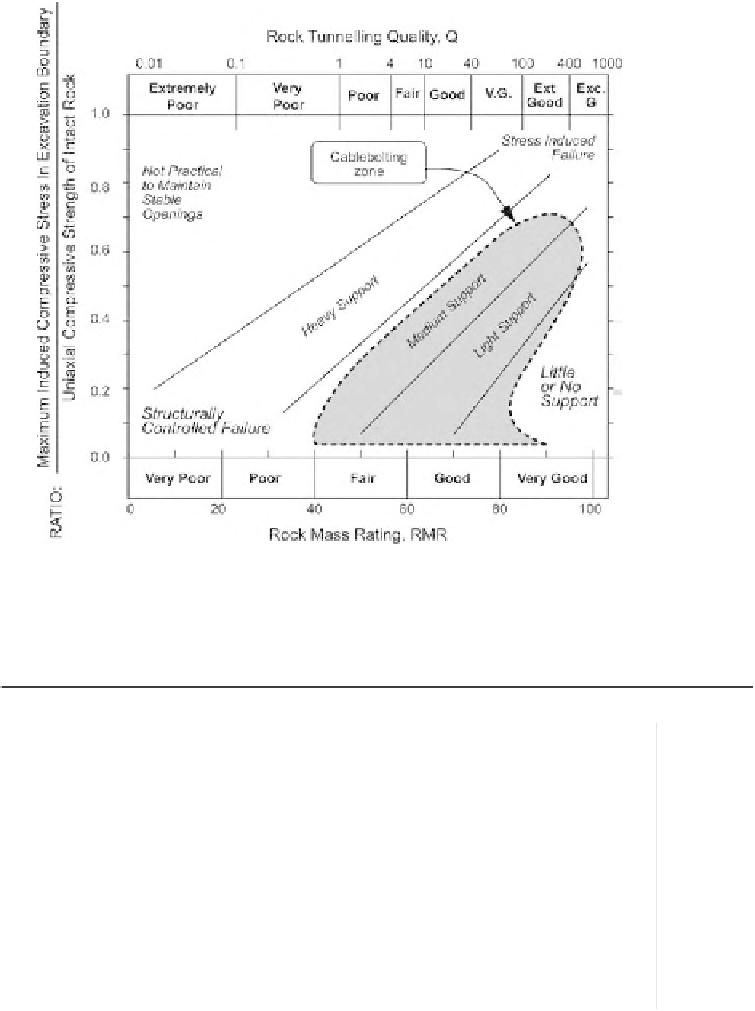
Figure 18.2
Cable bolt support (Hutchinson and Diederichs, 1996).
Table 18.17
Approximate support required using Q value (adapted from Barton et al., 1974).
Q Value
0.01
0.01-0.1
0.1-1.0
1-10
10-100
100-1000
Poor
Good
Description
Poor
Fair
Exception
Extremely
Very
OK/Very
Ext./Exc.
No rock support
Equivalent span/
height
0.15
0.25-0.8
0.8-2
2-5
5-12
12-30
4-100
4
<
---- Spot bolting ----
>
100
0.15 <---- Systematic bolting ----> 50
1.5-70
0.3-60
0.3
<
------- Bolts and shotcrete -------
>
60
0.15-50
0.15
<
------- Bolts and fibercrete -------
>
50
3
<
-- Cast concrete lining --
>
40
3-40
18.18 Prediction of bolt and concrete support using Q values
•
Additional details as extracted from Barton's 2006 graphs are presented
below.


Search WWH ::

Custom Search