Geoscience Reference
In-Depth Information
(a)
COI
TOL
ALI
LIS
CRT
ALM
SFS
MAL
0˚
3
58˚
356˚
(b) Waveforms
Fit for moment tensor solution (20s-50s)
mainshock Mw
=
6.1
TOL S-N
P
TOL E-W
P
100 s
Deconvolution of apparent source time function
STF:
Fit:
5s
Fig. 4
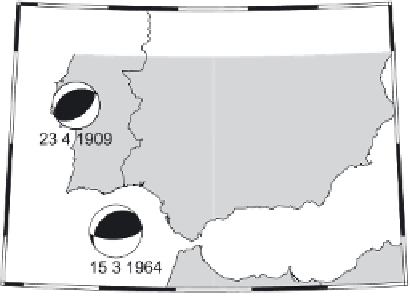
(
a
) Map showing early seismic observatories (
triangles
) and regional moment tensor esti-
mates from digitized analogue data for the south of the Iberian Peninsula (Pondrelli et al. 1999,
Stich et al. 2003, 2005, Batll o et al. 2008), showing a NE-SW orientation of P-axes and a change
in faulting style from east to west consistent with source estimates from modern broad band data
(Stich et al. 2006). (
b
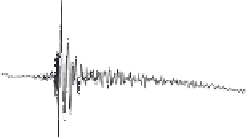
) Waveform examples for the 16 June 1910 Adra earthquake recorded at
station TOL, showing original seismograms after geometrical corrections (
left
), moment tensor fits
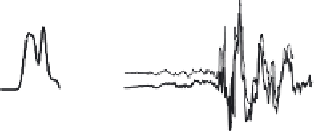
to intermediate period waveform (
upper right
, the inversion is based on 5 stations altogether, Stich
et al. 2003), and waveform fits and apparent source time functions from aftershock deconvolution
(
lower right
)
Green functions analysis based on aftershock waveforms (Stich et al. 2003, Batllo
et al. 2008, Fig. 4). Forward modeling of sparse regional waveforms can provide
valuable insight into focal mechanisms (Baroux et al. 2003), and slip distribution in
the case of large events like the Mw 7.1, 1908 Messina Strait earthquake (Pino


Search WWH ::

Custom Search