Geoscience Reference
In-Depth Information
To guarantee a similar spatial sampling for the pairs of historical and recent
events, we have clustered the recent localities inside circles of 10 km radius around
each historical site, and took the average intensity within each circle. For exam-
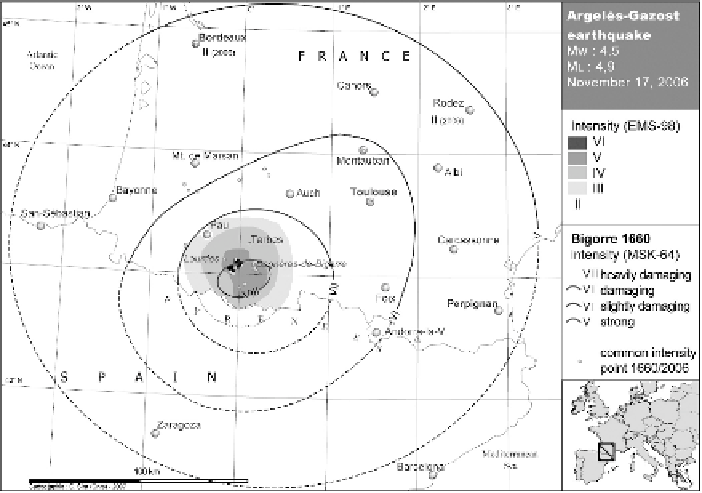
ple, intensities of the Argeles-Gazost (2006) earthquake is known in several lo-
calities around the city of Bordeaux while we have only one value of intensity in
Bordeaux for the Bigorre (1660) earthquake. With this procedure we can draw the
isoseismals of the recent and historical earthquakes from the same geographical
sampling. Historical intensities (MSK scale) are taken from the SisFrance data base
(www.sisfrance.net). The MSK scale (Medvedev et al. 1964), which was in use in
France until 2000, is now replaced by the EMS-98 (Grunthal 1998). The differences
between MCS, MSK and EMS are negligible at degrees smaller than or equal to V,
and are less than half a degree for larger degrees of intensity (Molin 1995). Working
with small intensities, we may thus confound the two scales. Figure 2 shows the
isoseismals drawn for the pair of events Argeles-Gazost (2006) - Bigorre (1660).
When the isoseismals are not complete, such as those cutting the Atlantic coast or
the Franco-Spanish border, we have linearly extrapolated each isoseismal area to a
full 360
◦
azimuthal range.
Once the macroseismic areas A(I) are known within each isoseismal, we convert
them into distance-intensity curves D(I)
=
√
A(I)
for both the reference and the
historical earthquakes, such as in Fig. 3. For the Argeles-Gazost (2006) earthquake,
we have completed the D(I) curve down to intensity II by setting its macroseismic
/
Fig. 2
Isoseismals and macroseismic areas for the Bigorre (1660, MSK-64) and Argeles-
Gazost (2006, EMS-98) earthquakes
Search WWH ::

Custom Search