Geoscience Reference
In-Depth Information
To explore this issue further, one can hypothesize that the values of III and IV
assigned by Hough (2000) in fact represent a mix of values between II and IV.
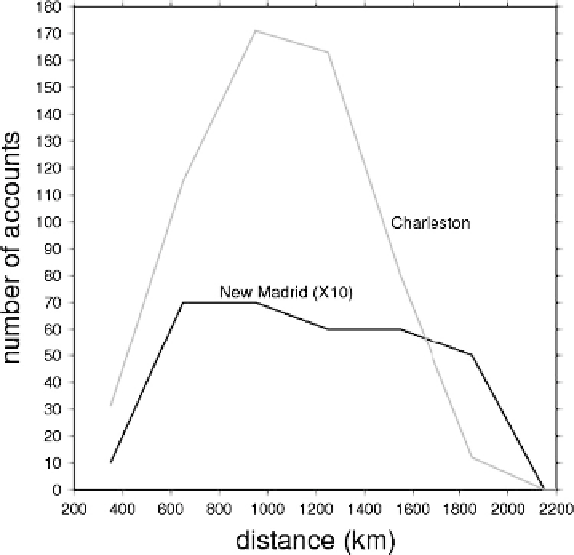
One can then consider the distribution of distances at which this these values were
observed for both of the earthquakes (Fig. 4). The distributions are similar. NM1
was weakly felt at
relatively
more locations at distances of 1800
km. This may,
however, reflect a relative concentration of population centers along the Altantic
seaboard at the time of the New Madrid earthquakes. To test this one can consider
the population distributions as revealed by the 1820 and 1880 US censuses. As-
signing each state population to the average latitude and longitude for that state,
one can examine state population as a function of distance from the Charleston and
New Madrid earthquakes, respectively (Fig. 5a). The relative number of potential
eyewitnesses to the New Madrid earthquake was indeed higher at distances greater
than 1000 km than at smaller distances (Fig. 5b.) Thus the apparently large relative
number of intensity values (i.e., felt reports) for NM1 at large distances may in fact
be due to the low number of potential witnesses at closer distances.
It is clearly impossible to interpret the macroseismic effects of the New Madrid
earthquakes without an appreciation for historical context, including settlement
+
Fig. 4
Distance distribution showing the number of available accounts of weak shaking during the
Charleston earthquake (
gray line
) and 16 December 1811 New Madrid mainshock (
black line
)as
a function of epicentral distance. Values for the New Madrid event are amplified by a factor of 10;
only about 100 total values are available for this event
Search WWH ::

Custom Search