Geoscience Reference
In-Depth Information
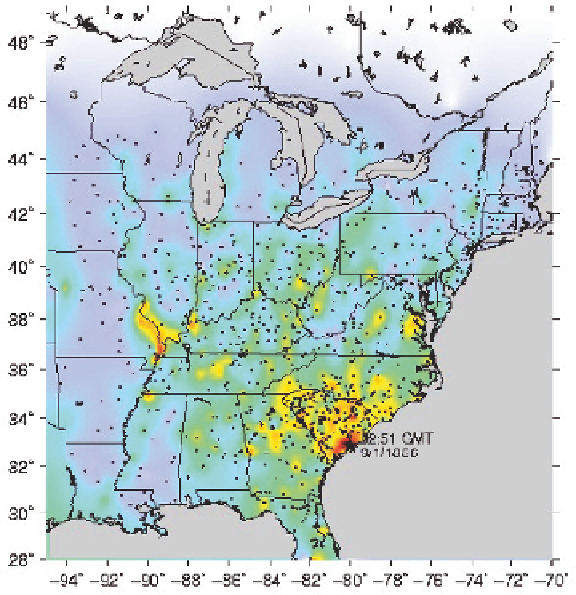
Fig. 2
Intensity map for the 1886 Charleston mainshock constrained by intensity values
determined by Bollinger (1977) using accounts compiled by Dutton (1889). Intensity values are
constrained for locations indicated by solid circles; between these locations intensity values are
interpolated. The decay of the far-field intensity pattern is artificially imposed
100 km of NM1; the latter are also poorly constrained, as I discuss below. Focusing
on average values for moderate MMI levels, Fig. 3b reveals that the two intensity
distributions are quite similar for distances
600 km, but that at greater distances
higher intensities are suggested for the New Madrid event.
However, the low intensity values (II-IV) assigned for NM1 require careful con-
sideration. A key distinction between the Charleston earthquake and NM1 is that
the former struck at 9:50 p.m. LT whereas the latter occurred around 2:15 a.m. LT.
Bollinger (1977) assigned values of II and III at locations where the shaking was de-
scribed as felt by only those at rest and generally felt by those indoors, respectively.
Assuming that NM1 was felt only by those who were awakened by the shaking,
Hough et al. (2000) assigned MMI values of IV to accounts that described the shak-
ing in any detail, making the conservative assumption that witnesses were asleep
and were awakened by the shaking. Values of III were assigned to those locations
where it was only noted that the shaking was felt. Values of II-IV are thus clearly
difficult to distinguish for NM1.
<
Search WWH ::

Custom Search