Geoscience Reference
In-Depth Information
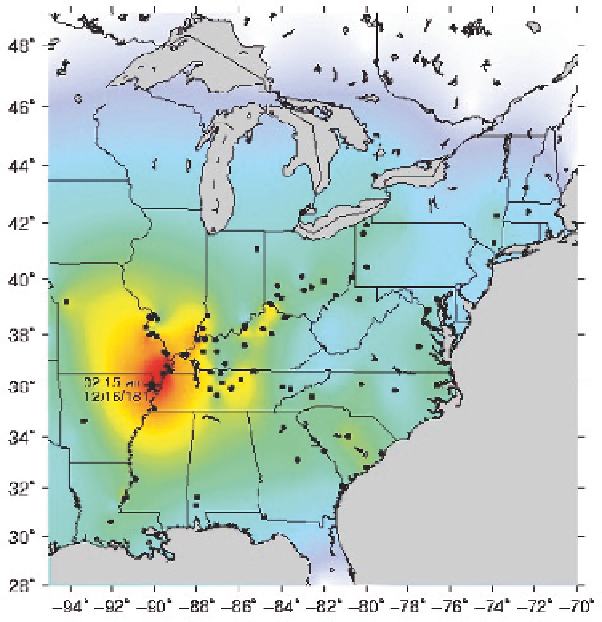
Fig. 1
Intensity map for the 16 December 1811 New Madrid mainshock constrained by intensity
values determined by Hough et al. (2000) and Hough (2004). Intensity values are constrained for
locations indicated by solid circles; between these locations intensity values are interpolated. The
decay of the far-field intensity pattern is artificially imposed
the values shown in Fig. 3b. Figure 3b also shows the average distance at which
each intensity level is observed for both earthquakes. Intensity values,
I
, for a given
earthquake can typically be fit by
I
=
A
−
B(
r
)
−
Clog(
r
)
(1)
Where A, B, and C are constants and
r
is epicentral distance. Fitting this equation
to the intensity values for Charleston and NM1 yields the curves shown in Fig. 3a.
These curves suggest that, on average, New Madrid intensity values are system-
atically about 1 unit larger than Charleston values any given distance. However,
focusing on the average values within distance bins (black and gray stars), it is clear
that average values of moderate intensities (V-VIII) are very similar. The overall
amplitude of the NM1 curve is strongly controlled by, first, a couple of high inten-
sity values at
100 km, and, second, high values at distances around 1000 km. The
former are very poorly constrained given the paucity of well-built structures within
∼
Search WWH ::

Custom Search