Geoscience Reference
In-Depth Information
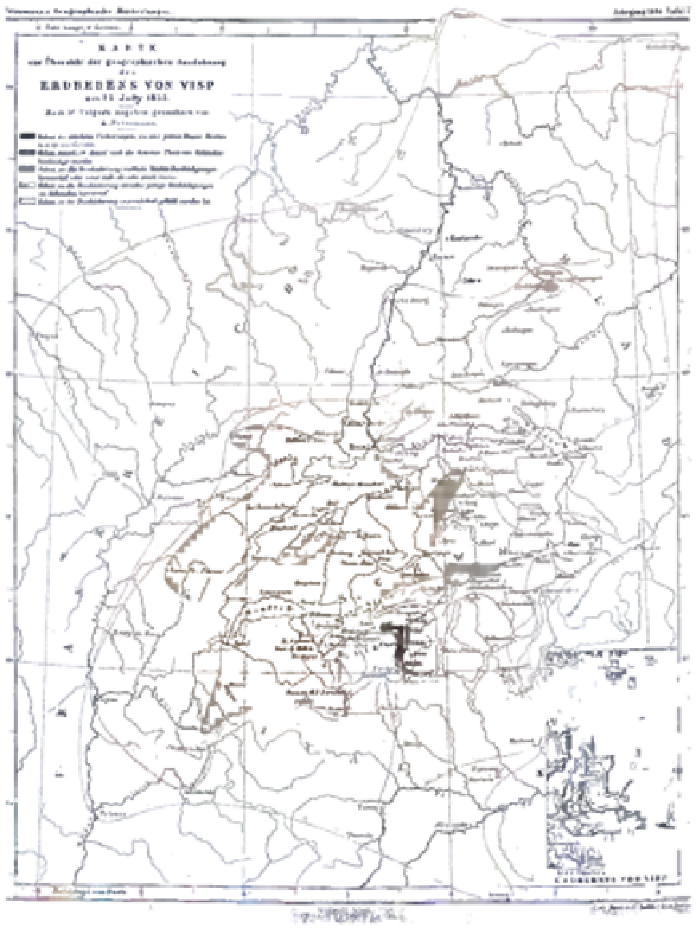
Fig. 6
Map with survey of the geographic perception of the 1855 July 25th Visp earthquake. Drawn
by A. Petermann after data submitted by O. Volger.
Z
ones of different level of seismic damage are
given by five tones of brown. Volger, 1856, ETHZ RARA: 1058: 1856
different tones of brown colors designate the relevant zones (Fig. 6). The author did
not assign values to the individual earthquake damage degrees, which makes his
classification more general; the largest damage was related to the Visp 1855 highest
intensity. However, he did not realize that no data was obtainable from uninhabited

Search WWH ::

Custom Search