Geoscience Reference
In-Depth Information
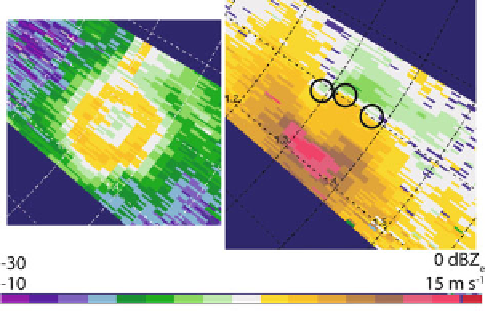
Figure 6.58. Secondary satellite vortices in a dust devil in northwest Texas on May 25, 1999, as
depicted by the U. Mass. W-band, mobile Doppler radar. (Top left) Radar reflectivity factor
color-coded below; (top right) Doppler velocity color-coded below; cyclonic shear vortex
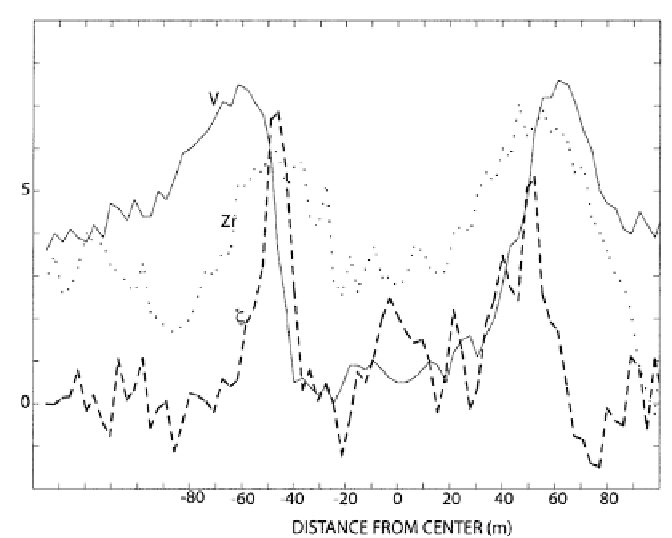
signatures indicated by circles. Range rings shown every 100m. (Bottom) Approximate vor-
tex-relative azimuthal wind (V, solid line, m s
1
), vorticity (
, dashed line,
10 s
1
), and relative
equivalent radar reflectivity factor (dotted line) Z
r
¼ð
Z
e
Z
noise
Þ=
C, where Z
e
is the equiva-
lent radar reflectivity factor (dBZ), and C is a dimensionless compression factor chosen
subjectively. The vorticity at the center is estimated as the average of the vorticities computed
just to the right and left of the center (from Bluestein et al., 2004a).
Search WWH ::

Custom Search