Geoscience Reference
In-Depth Information
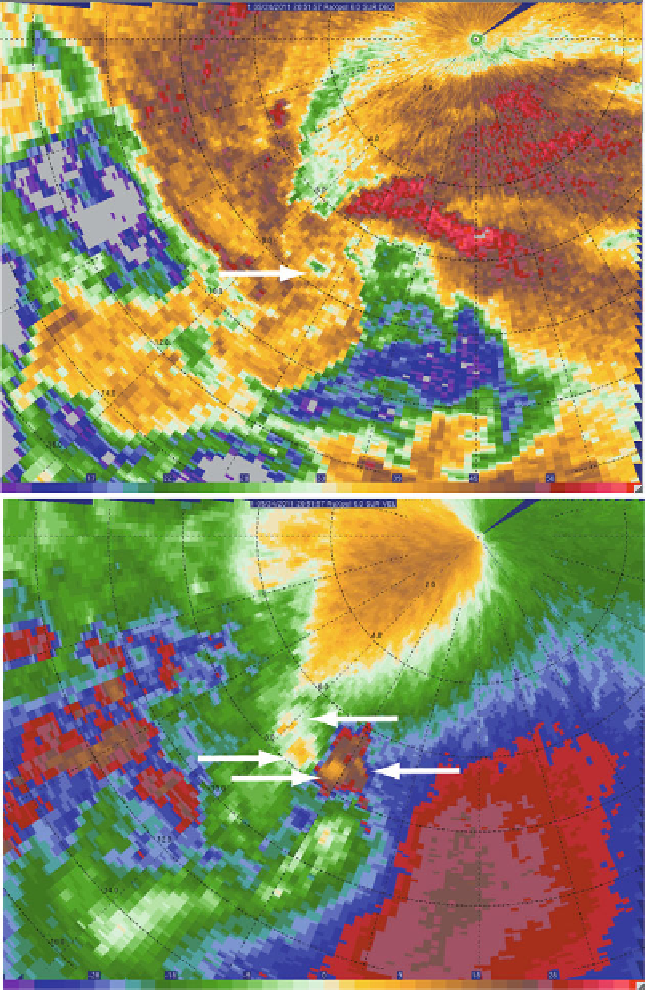
Figure 6.23a. Examples of vortices of different scales in and around a tornado, as seen by a
mobile Doppler radar. (Top) Radar reflectivity from RaXPol in central Oklahoma on May 24,
2011; arrow points to the weak-echo hole at the center of the tornado. (Bottom) As in the
top, but for aliased Doppler velocity; velocity data are not corrected for folding to highlight
the Doppler velocity extrema (in yellow); left-pointing arrows highlight extrema for the
mesocyclone, while right-pointing arrows highlight extrema for the smaller scale tornado.
Search WWH ::

Custom Search