Geoscience Reference
In-Depth Information
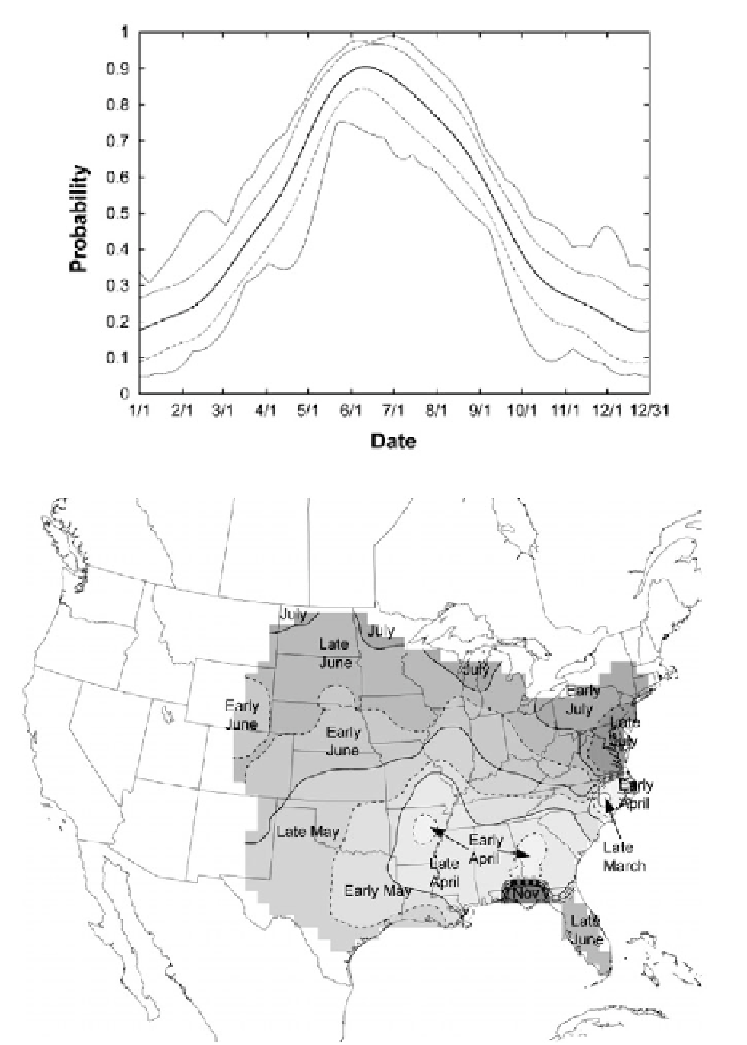
Figure 6.20. Tornado threat in the U. S. by time of year. (Top) Probability of a tornado day
anywhere in the U. S. The heavy black line marks the mean value, the dashed lines indicate the
mean
1 standard deviation value, and the thin black lines mark the maximum and miniumum
values, all for the 1980-1999 period; (bottom) month (or part of month) of maximum tornado
threat in the U. S. for locations with at least 0.25 tornado days/year (from Brooks et al., 2003b).
Search WWH ::

Custom Search