Geoscience Reference
In-Depth Information
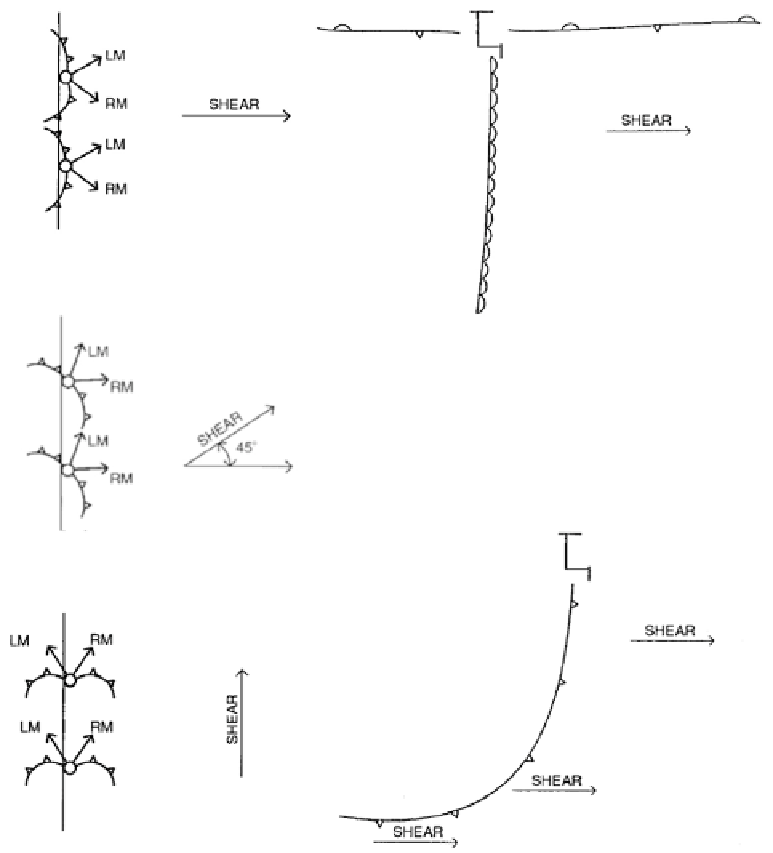
Figure 4.60. Idealized illustration showing how neighboring storms might interact according
to how the mean vertical shear vector is oriented with respect to a line along which convective
storms are triggered. (Two columns at the left) Initial thermal bubbles shown by open circles.
Cold front symbols denote outflow boundaries. ''RM'' and ''LM'' denote storm motion
(vectors) of right and left-moving cells. Vertical shear vector indicated in the middle. (Right)
Typical synoptic-scale features in the Great Plains of the U. S. Note how the orientation of the
shear vector may vary along the boundaries where storms may form. In the case in which the
vertical shear vector is normal to the initiation line, the storms at the ends of the line in the
direction normal and to the right of the shear in the figure are most likely to become an isolated
supercell; in the case in which the shear is about 45
from the initiation line, all storms could
develop into isolated RM supercells; in the case in which the shear vector is parallel to the
initiation line, only the storm at the end of the line in the downshear direction is likely to
develop into an isolated RM supercell (from Bluestein and Weisman, 2000).

Search WWH ::

Custom Search