Geoscience Reference
In-Depth Information
T
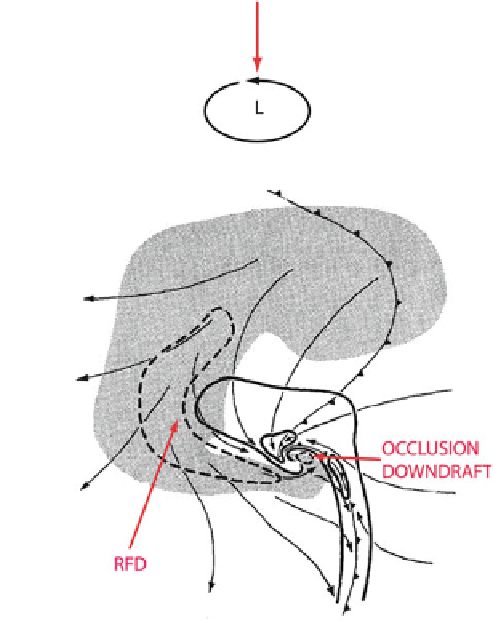
Figure 4.58. Occlusion downdrafts. (Top) Downward-directed dynamic perturbation pressure
gradient force (red vector) at the center of a low-level cyclone that decreases in intensity with
height; the strongest central pressure deficit is at the surface (L). (Bottom) Summary of features
at low levels in a numerical simulation of a supercell. Streamlines indicate storm-relative wind
field. Vertical velocity is contoured at 2m s
1
intervals with the zero line omitted; dashed
contours indicate downward velocities and solid contours indicate upward velocities. Cold
front symbol denotes the leading edge of the rear-flank gust front below and the forward-flank
cool outflow boundary above. The ''T'' denotes the location of maximum vorticity, perhaps
where a tornado might be located. Shaded region indicates rainwater content in excess of
0.5 g kg
1
, which represents roughly the outline of an outer radar reflectivity contour. Note
how the occlusion downdraft for the mesocyclone is displaced slightly from the vorticity
maximum (from Klemp and Rotunno, 1983).
4.59,
top panels) and instances in which the mesocyclone does not occlude
(NOCM, non-occluding cyclic mesocyclogenesis). In the latter, low-level meso-
cyclones do not go through an occlusion process as part of their normal life cycle;
instead the mesocyclone propagates away from the updraft along the leading edge
of the outflow on the forward flank (
Figure 4.59,
bottom panels). For vertical
shear below some level, results from numerical simulation experiments indicate
that OCM is favored by hodographs with some curvature.
Search WWH ::

Custom Search