Geoscience Reference
In-Depth Information
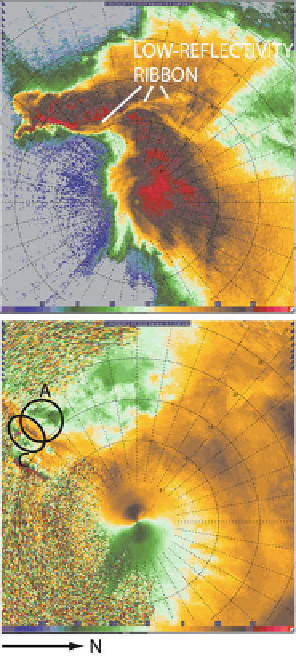
Figure 4.30. A cyclonic (C, ellipse)-anticyclonic (A, circle) Doppler velocity shear couplet at
mid-levels in a supercell in southwestern Oklahoma on May 23, 2011, from data from the
RaXPol mobile Doppler radar. The radial at which the cyclonic-anticyclonic couplet is seen is
oriented approximately along the mean vertical shear vector at mid-levels. (Top) Equivalent
radar reflectivity factor color-coded in dBZ
e
. (Bottom) Doppler velocity color-coded in m s
1
.
A ''low-reflectivity ribbon'' is also seen dividing the storm in half.
perturbation pressure gradient
p
0
d
=@
p
0
d
=@
2
x
2
c
x
¼@=@
x
½@=@
t
ð@
z
Þ=@
=@
ð@
z
Þ
ð
4
:
28
Þ
p
0
d
=@
2
y
2
p
0
d
=@
c
y
¼@=@
y
½@=@
t
ð@
z
Þ=@
=@
ð@
z
Þ
ð
4
:
29
Þ
where c
x
and c
y
are the x and y-components of forced upward motion centers due
to upward-directed dynamic perturbation pressure gradient forces. Updrafts
propagate against the horizontal gradient in the tendencies of vertical dynamic
perturbation pressure gradients (
Figure 4.31
). (The effects of buoyancy and gust
fronts are not included in this analysis here so we can isolate the effects of
dynamic perturbation pressure gradients.) Since updrafts are kinematically asso-
ciated with low-level convergence, and convergence acting on existing vertical
Search WWH ::

Custom Search