Geoscience Reference
In-Depth Information
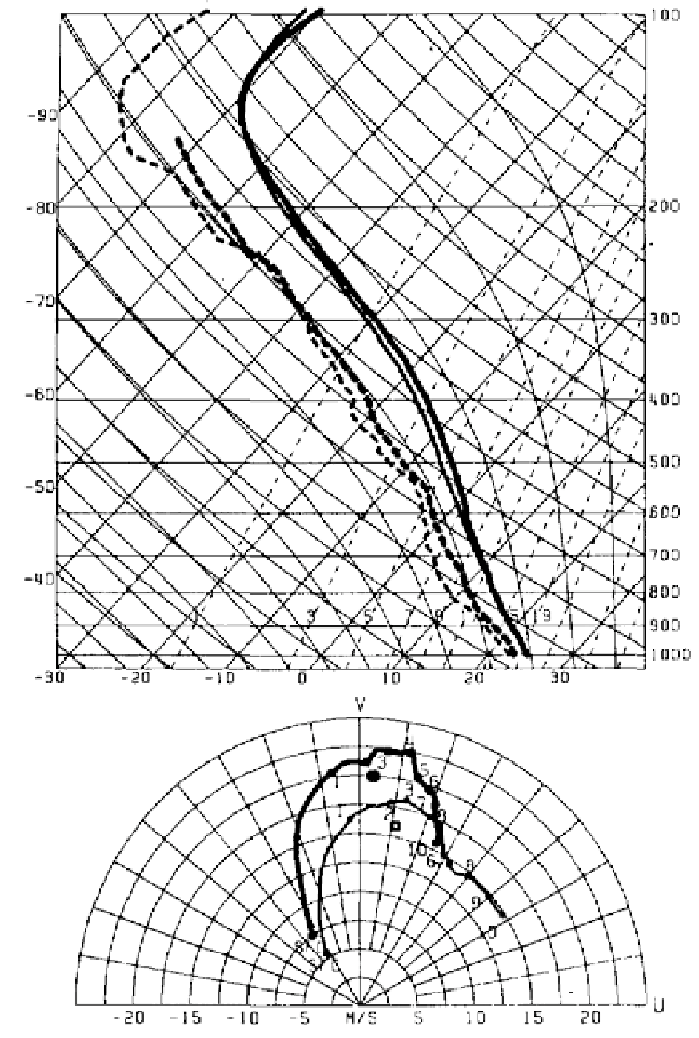
Figure 4.2. Thermodynamic composite sounding (top) and hodograph (below) for right-front
quadrant in hurricanes. Skew T-log p soundings within 300 km of hurricane center plotted by
heavy lines, soundings beyond 300 km of hurricane center plotted as light lines. In soundings,
solid lines are temperature (
C) and dashed lines are dew point (
C); pressure plotted at right in
hPa. In hodographs, height MSL plotted in km (from McCaul, 1991).

Search WWH ::

Custom Search