Geoscience Reference
In-Depth Information
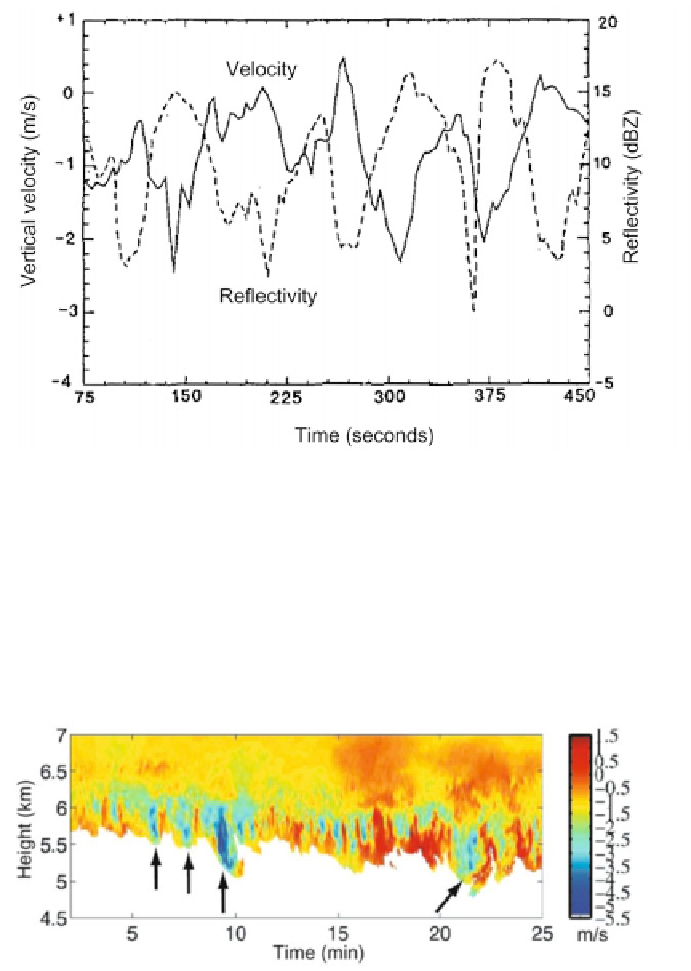
Figure 3.30. Ground-based, Ka-band, vertically pointing Doppler radar observations of
cumulonimbus mammatus in north central Manitoba, Canada during the early morning of
August 2, 1994. The vertical velocity and radar reflectivity factor are negatively correlated:
highest magnitudes of radar reflectivity factor correspond to the strongest descending motion,
while the lowest magnitudes of radar reflectivity factor correspond to the weakest descending
motion. Since the cloud was translating by, one can convert time to space and infer the spacing
between mammatus elements as on the order of a kilometer (from Martner, 1995).
Figure 3.31. Ground-based, W-band, vertically pointing Doppler radar observations of
cumulonimbus mammatus in South Florida on July 22, 2002. The mammatus were pendant
from a 6 km thick cirrus anvil. Doppler velocity is shown, with upward velocities given as
positive, as a function of time; since the cloud was translating by, one can convert time to space
and note the similarility in the cloud edge to the pouch-like visual appearance of mammatus,
which are spaced about every 200-600m. The Doppler velocities represent the air motions
added to the fall speed of the ice particles. Arrows highlight some individual mammatus
elements in which the center of the mammatus is descending (from Kollias et al., 2005).
Search WWH ::

Custom Search