Geoscience Reference
In-Depth Information
p
Figure 3.20. Gust front passage. (Top) Visualized from the air (on board a NOAA P-3
aircraft) off the east coast of Florida on August 25, 1993; the precipitation curtain is seen to the
left, spreading out at the sea surface. The white dashed line marks the leading edge of the gust
front, visualized as a change in the color of the sea surface. (Bottom) Temperature, wind, and
pressure as a function of time during passage of a strong gust front in central Oklahoma on June
15, 2011 (OklahomaMesonet data courtesy of Chris Fiebrich). The gust front passage is marked
by a drop in temperature from the mid-90s F to less than 70
F over a time period of less than
10min, a wind shift from south-southwesterly to northerly and east-northeasterly, a pressure
fall followed by a general rise, with smaller scale pressure fluctuations and a gust of about
70mph. The strong gust represents a microburst (photograph by the author).
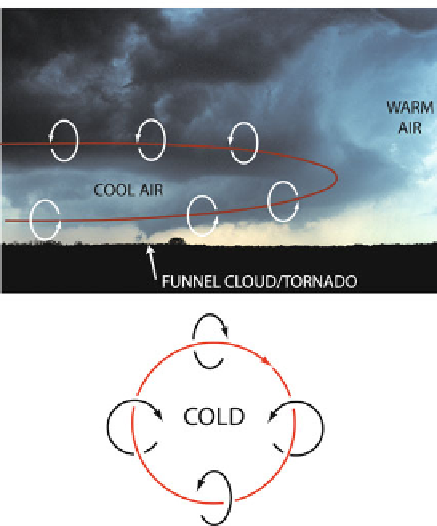
Figure 3.21. Illustration of the baroclinic generation of a vortex ring (sense of rotation indi-
cated by white arrows) about a region of evaporatively cooled air (edge of cool air indicated by
solid red line) embedded within an ambient region of warm air, (top) in a tornadic supercell in
eastern Oklahoma on May 26, 1997 (photograph by the author). (Bottom) Plan view of a
vortex ring induced solenoidally by a circular cold pool. Sense of vortex ring given by red line;
circulations induced in the vertical plane denoted by black curved arrows.
modeling by Ramesh Srivastava (while he was at NCAR), in which ice processes
were not included, indicated that the strength of downdrafts depends on the lapse
rate, the rainwater mixing ratio at the top of the downdraft, decreasing raindrop
size, and, counter-intuitively, the humidity of the environment. When the environ-
ment
is more humid,
the virtual
temperature is higher, so buoyancy in the
downdraft is more negative.
Search WWH ::

Custom Search