Geoscience Reference
In-Depth Information
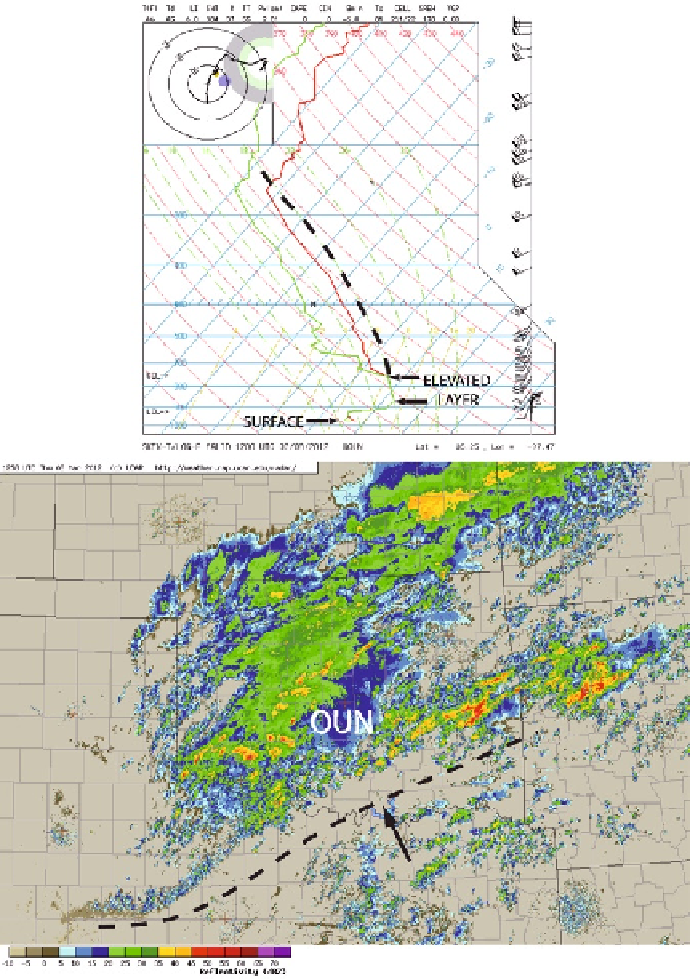
Figure 3.2a. Elevated convection. (Top) Sounding at Norman, OK (OUN) at 12:00
utc
on
March 8, 2012; elevated thunderstorms as depicted by WSR-88D composite radar reflectivity
in dBZ (bottom) occurring north of a cold front (dashed line at the bottom) as air flowing from
the southeast (arrow in the bottom panel) rises over the frontal zone (stable layer between 920
and 870 hPa. In the top panel the elevated LCL is indicated as a saturated layer between 880
and 750 hPa. Surface parcels lifted will not attain an LCL. Above the elevated LCL, air parcels
follow the moist adiabat (dashed line), where CAPE is realized.
Search WWH ::

Custom Search