Geoscience Reference
In-Depth Information
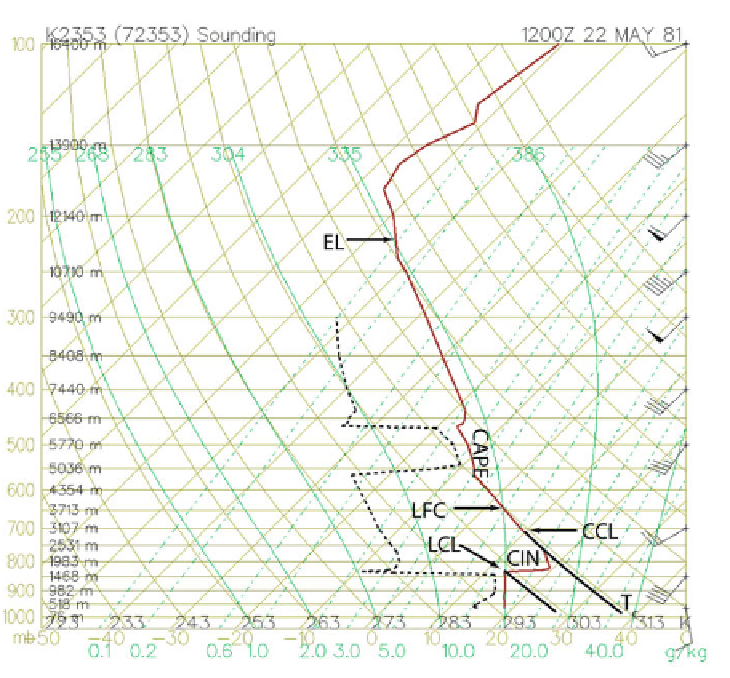
Figure 3.1. Illustration of how some significant thermodynamic parameters are computed
from a sounding, using as an example a sounding ahead of the dryline on May 22, 1981 at
12:00
utc
, at Oklahoma City, OK (sounding data and graphics from the Plymouth State
College archive). The vertical temperature profile is shown by the solid red line and the dew
point vertical profile by the dashed black line. For a surface temperature of about 27
C
(isotherms are skewed brown lines, labeled in
C along the abscissa), the LCL is about 840 hPa
(isobars shown as horizontal brown lines, labeled on the ordinate in hPa), the LFC is about
650 hPa, and the EL is about 220 hPa. CIN and CAPE are illustrated graphically as the areas
between the temperature and the moist adiabatic for the equivalent potential temperature of
335K (curved green line). The convective temperature (T
c
) is about 38
C for a mixed layer
water vapor mixing ratio (dashed green lines) of about 11 g kg
1
; the CCL is about 700 hPa.
Later, on this day, there were tornadic supercells to the west.
tion level'' (CCL). When air reaches its LCL or CCL, cloud particles may form
(we will ignore the complexities of microphysics in this discussion).
The amount of potential energy that must be overcome to lift air to its LCL is
called ''convective inhibition'' (CIN) (
Figure 3.1
) and the level at which the air
first becomes buoyant is called the ''level of free convection'' (LFC) (
Figure 3.1
).
If cloud particles do form, latent heat is released and, when the environmental
lapse rate is greater than that of the moist adiabatic, the temperature excess of the
Search WWH ::

Custom Search