Geoscience Reference
In-Depth Information
Table 5.2
Average vertical and horizontal velocities
Variable
Time period
Velocity
1983-1988
0.662 m/yr
±
0.083 m/yr
Mean horizontal velocity
1988-1998
0.548 m/yr
±
0.041 m/yr
0.520 m/yr
±
0.048 m/yr
2003-2008
±
Mean thickness change
1983-1998
- 0.299 m/yr
0.076 m/yr
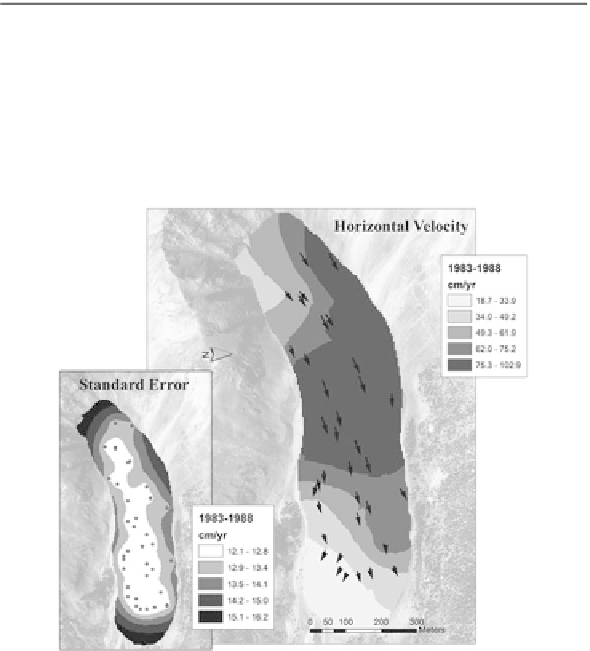
Fig. 5.3
Horizontal rates of flow from 1983 to 1988
Vertical change in thickness, calculated from subtracting DEMs for different
image dates, averaged a loss of 30 cm/yr (
8 cm/yr) from 1983 to 1998 (Table
5.2
).
A visual inspection of change suggests that thinning was most concentrated near the
head and northern edges of the rock glacier (Fig.
5.6
).
±
5.4.2 Field GPS Measurements
GPS surveys indicate a mean horizontal velocity of 52 cm/yr (
5 cm/yr) from 2003
to 2008. Point 7 near the toe of the rock glacier had the least displacement (30 cm/yr)
(Fig.
5.7
). Greater displacements were observed near the midsection (63-65 cm/yr).
Point 1, located closest to the head of the rock glacier, however, is an exception to
this pattern (Fig.
5.7
). This point is unique because of local ridge advection or ice
thinning.
±