Geoscience Reference
In-Depth Information
Table 4.2
Score matrix of the first three factors derived from ecological niche factor analysis
(ENFA) and the percentage of variance explained by each factor
Factors
Va r i a b l e s
1
2
3
Curvature
0.008
0.010
-0.012
Elevation
0.024
0.614
-0.596
EucDist
a
0.997
-0.056
-0.255
Slope
0.056
0.776
-0.251
TPI
-0.041
0.092
-0.513
TRMIM
-0.015
-0.093
0.063
Variance explained (%)
78.8
14.2
3.6
a
EucDist - Euclidean distance from the boundary of sandstone and limestone formations
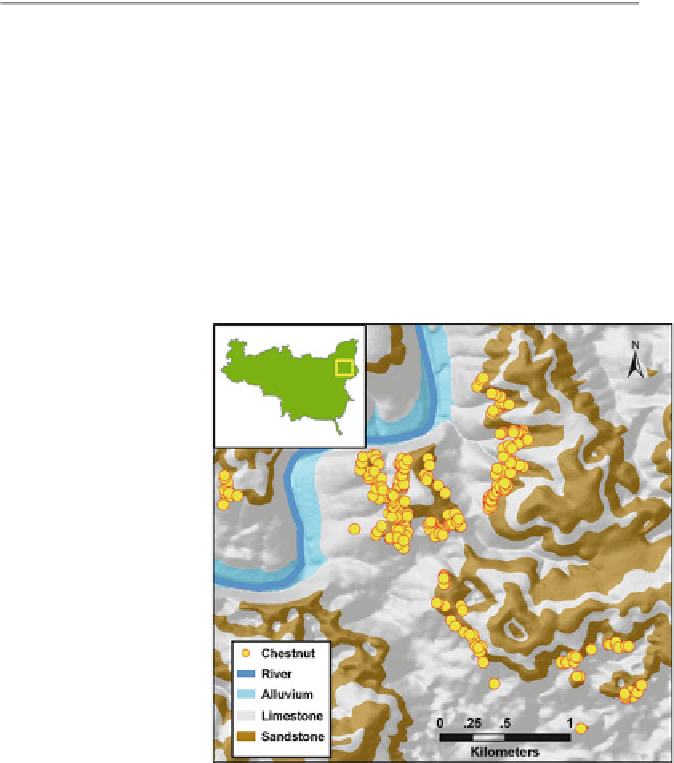
Fig. 4.4
Example of
American chestnut spatial
distribution on a topographic
relief geological map
4.3.2.3 Habitat Map
Two habitat maps were generated for American chestnut (Fig.
4.5
). Biomapper 3.1
provided a continuous habitat suitability map with a range of 0-100, but it did not
provide a threshold of favorable chestnut habitats. Based on the maximum cumula-
tive frequencies difference method (Browning et al.
2005
; Thompson et al.
2006
),
the threshold of favorable chestnut habitats was around a habitat suitability of 16.
To make a conservative prediction, we defined areas as favorable chestnut habi-
tats when habitat suitability was greater than 20. Figure
4.5a
is the overall habitat
suitability map for American chestnut in Mammoth Cave National Park. About
28% of the areas were predicted as favorable chestnut habitats. Suitable habitat