Geoscience Reference
In-Depth Information
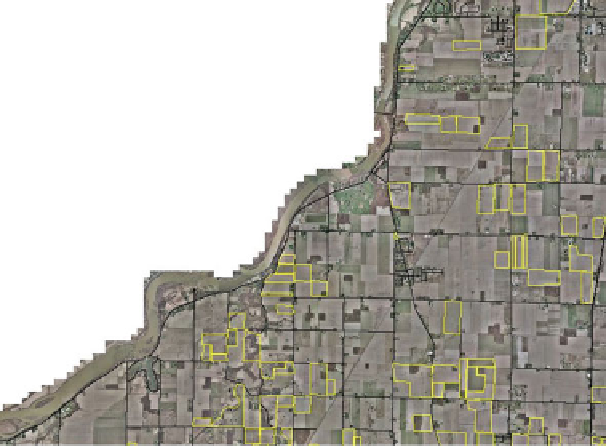
Fig. 10.3
Permitted field polygons were hand drawn from paper plat maps provided by the local
EPA office over an aerial photograph. (Source: McNulty
2005
)
locations and a cleaner topology of the permitted fields. The following steps were
taken to ensure better accuracy.
•
Aerial photographs were analyzed to verify the shape of the permitted field poly-
gons. Heads-up digitizing was performed to match the shape of the permitted
field polygon to the shape of the field.
•
Permitted field polygons were compared with the parcel layer polygons provided
by county auditor's offices to verify that it was within the parcel boundaries.
•
Overlap of permitted field polygons with forested polygons was adjusted such
that a permitted field did not include any forested area.
•
A comparison of permitted field acreage listed on the EPA reports was com-
pared to the measured acreage of the polygons produced. Substantial difference
indicated an issue and the field was subsequently resolved.
•
A comparison of farmer/owner name to the name listed on the parcel by the
auditor was used to verify the location of the fields. Differences in owner name
indicated a potential issue and the field was subsequently resolved.
The permitted fields are designated with a number and letter by the OEPA that
represents the township that the permitted field is in (Fig.
10.4
). This leads to some
confusion because a single county can have two or more fields with the same des-
ignation such as 27j. In addition, a field may be designated 27j in more than one
county. The parcel ID was used as a unique identifier instead of the permitted field
designation.