Geoscience Reference
In-Depth Information
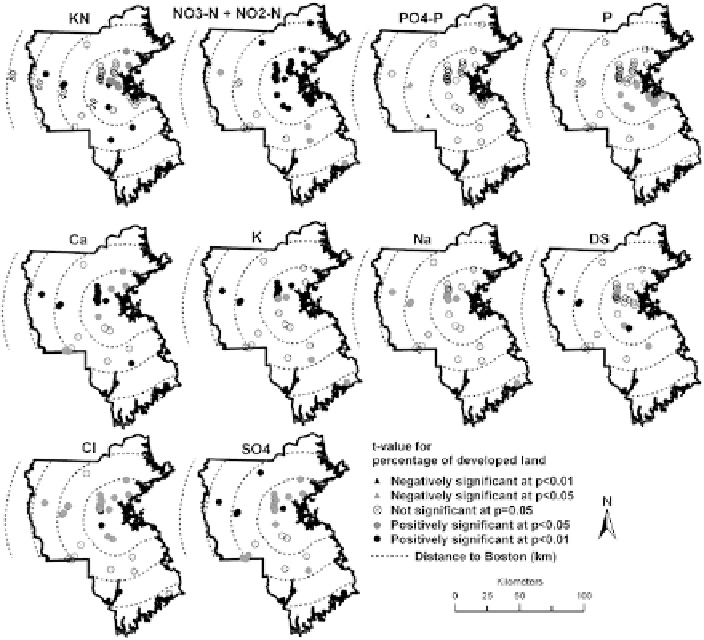
Fig. 9.3
Results of t-test on the parameter estimates for developed land from the GWR models
(The
t
-values for NO
2
-N, NH
3
-N, SC and Mg are positively significant at
p
<0.005 at all sampling
sites)
variable and dependent variable at different sampling sites. Thus, in a GWR model
for a water quality indicator and an urbanization indicator, the local parameter esti-
mates for the urbanization indicator are used to describe the relationships between
the water quality indicator and the urbanization indicator at different sampling sites.
In addition, the local
R
2
values from the GWR model reflect the abilities of the
urbanization indicator to explain the spatial variance in the water quality indicator
at different sites.
Figure
9.3
shows the values of
t
-test on the local parameter estimates for PDLU
obtained from the GWR models. Positive correlations are found between devel-
oped land and most water quality indicators at all the sampling sites (Table
9.1
and
Fig.
9.3
). They are significant for SC, NO
2
-N, NH
3
-N and Mg in the whole study
area and for other water quality indicators at many sampling sites (Fig.
9.3
). This
result indicates that higher percentage of developed land is associated with higher
concentrations of most water quality indicators.

