Geoscience Reference
In-Depth Information
where
w
ij
is the weight of data point
j
for point
i
,
d
ij
is the distance between
i
and
j
,
b
is the kernel bandwidth. When the distance is greater than the kernel bandwidth,
the weight rapidly approaches zero.
By using this weighting function to calibrate the model, GWR produces a set of
local regression results including local parameter estimates, the values of
t
-test on
the local parameter estimates, the local
R
2
values, and the local residuals for every
spatial data point (water quality sampling site in this study).
The local statistics obtained from the GWR analyses were interpreted and dis-
cussed to examine the spatially varying relationships between urbanization and
water quality indicators in the following sections.
9.5 Results
9.5.1 Spatial Variations in Urbanization Indicators
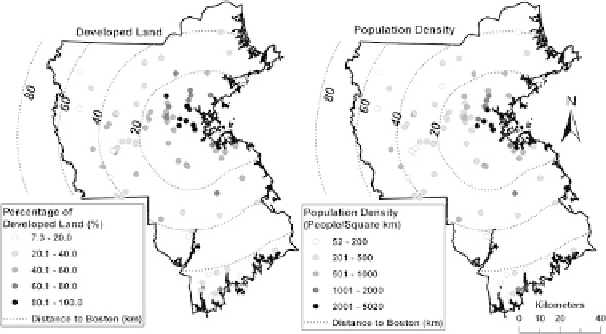
The spatial patterns of the urbanization indicators can be identified from Fig.
9.2
.
Most sites within the 20-km buffer of Boston have PDLU higher than 80%, so these
sites are within highly-urbanized central city areas. Most sites between the 20-km
and 40-km buffers have PDLU below 40%. A value of PDLU less than 20% is
observed for many sites outside the 40-km buffer of Boston. Therefore, the water-
sheds beyond 20-km buffer are considered as less-urbanized suburban and rural
areas. Likewise, the highest PD values (>2000 people/km
2
) are found at many
sites inside the 20-km buffer, the highly-urbanized metropolitan Boston area; the
PD values for some sites in this area even reach 5000 people/km
2
. PD below 500
people/km
2
is observed for most of sites between the 20 and 40-km buffers, while
most sites outside the 40-km buffer have the lowest PD (<200 people/km
2
;Fig.
9.2
).
Thus, a clear urbanization gradient exists from Boston to outside of the metropolitan
area.
Fig. 9.2
Spatial patterns of urbanization indicators