Geoscience Reference
In-Depth Information
1600
eclogite
50
1400
1200
40
blueschist
1000
Barrovian
assemblages
30
800
granulite
amphibolite
600
20
greenschist
400
10
zeolite
200
hornfels
0
100
200
300
400
500
600
700
800
900
1000
temperature / °C
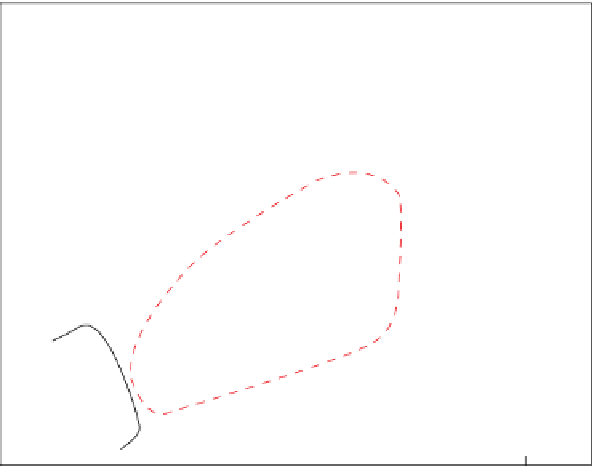
Figure A9.1
The metamorphic facies diagram, dividing
P-T
space into different fi elds characterized by
particular mineral assemblages in mafi c rocks. The wet melting curve for granite is also shown, and the
approximate region of Barrovian metamorphic assemblages is outlined (dashed line).