Geoscience Reference
In-Depth Information
N
8
Figure 8.12
Variable minor
fracture plane data (blue arcs)
and slickenline data (red dots)
represented on a stereographic
plot. The main group of fracture
plane data is interpreted to
approximate to the overall fault
zone orientation (dipping
moderately NE), while the main
cluster of lineation data marks the
overall slip direction (plunging
gently NNW).
n = 25
equal area
(a)
(b)
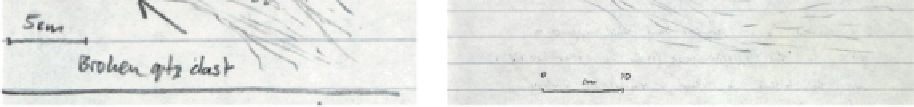
Figure 8.13
Kinematic indicators from the fault zone. (a) Broken clast of quartz vein within fault
zone. (b) Suspected Riedel fractures near edge of zone. (Notebook of Tom W. Argles, The Open
University, UK.)