Geoscience Reference
In-Depth Information
Fossils
8
7
6
6
6
5
5
4
4
3
3
2
2
1
1
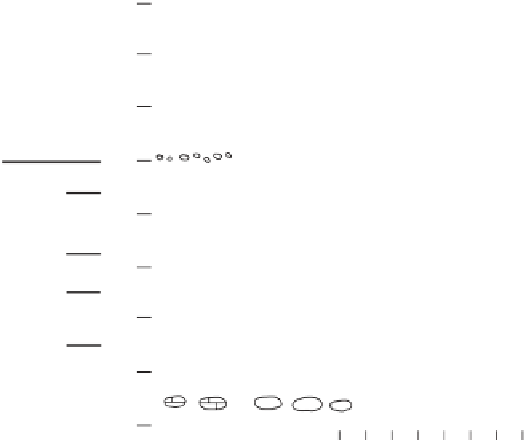
Figure 6.6
Same graphic log as
Figure 6.4 but with the sedimentary
structures and lithology in two
separate columns.
0
vf
f
m
c vc
sand
•
sedimentary structures are shown as idealized symbols only;
•
note that colour is usually used on graphic logs only when
it is one of the main defi ning characteristics (e.g. in a
mudrock succession) or for visual purposes for oral
presentations.
•
completing the graphic log on a pre-formatted graphic
logging sheet or directly into a fi eld notebook (Section 6.3.2).
6.3.2 Constructing a graphic log
1. Prepare your notebook or graphic logging sheet(s). Divide
up the notebook page with vertical ruled lines, both to
order the data systematically and to serve as a reminder
for what data need to be collected. If necessary use two
facing pages for all the different columns pertaining to one
unit. There are various options for the format according to
personal preference; some examples are shown in Figure
6.7a (p. 122). Some people use preformatted graphic
logging sheets (e.g. Figure 6.7b). If logging sheets are put
onto standard quality paper the paper and large size of the
sheet can be susceptible to damage under poor weather


