Geoscience Reference
In-Depth Information
Worked Example 5.2 Measuring abundance
5
(
(
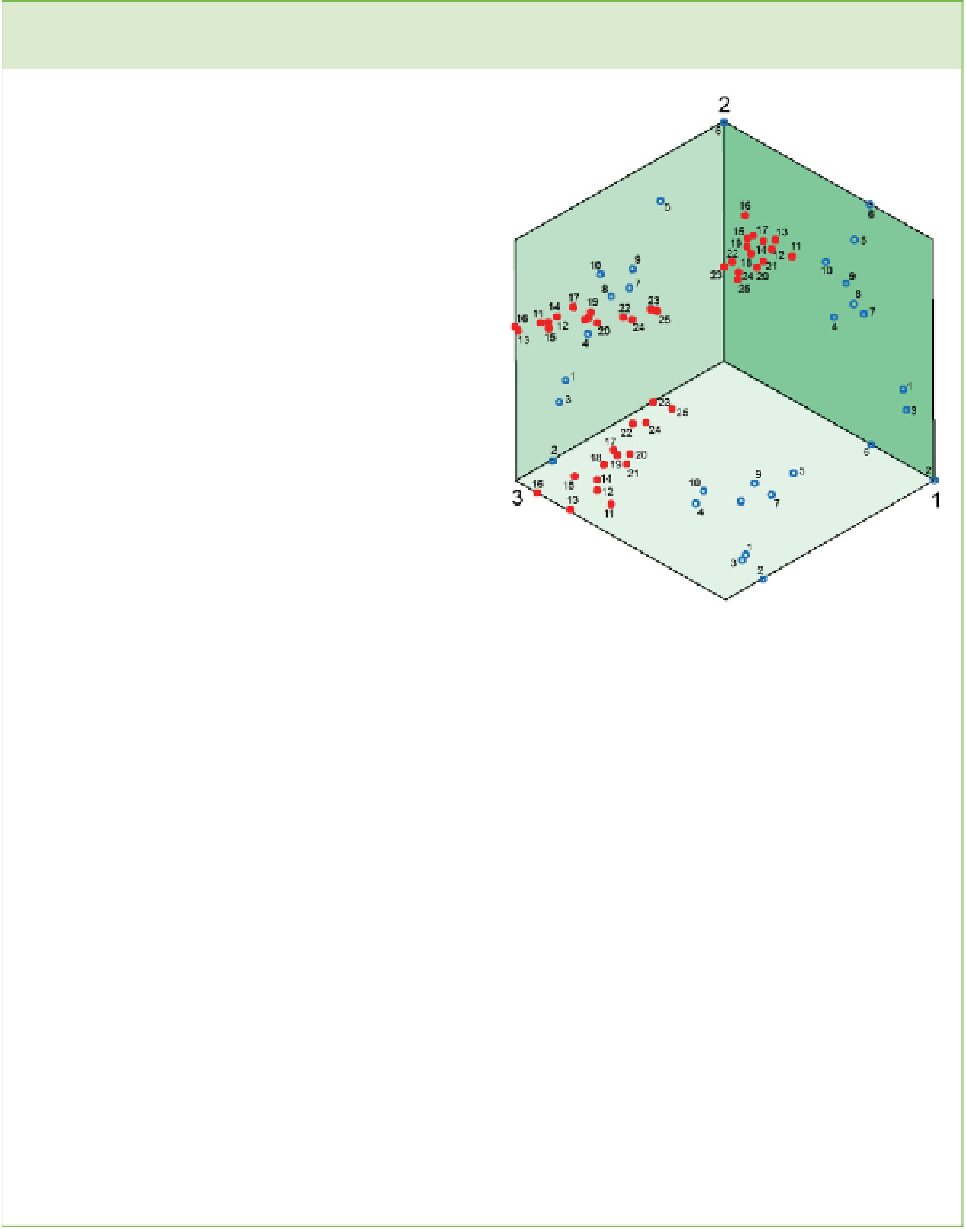
Figure 5.13
Correspondence analysis of samples from the Jurassic plant fossil locality at Hasty Bank,
Yorkshire, UK. The diagrams show three faces of a hollow cube onto which the positions of samples are
projected from three-dimensional space; this means that each plot has three times as many points as there
are samples. The three sides of the cube represent the fi rst three axes of greatest variation in the analysis.
The sample points are numbered for cross referencing. Samples from siltstones are represented as open
blue circles while closed red circles represent samples from claystones. (a) Abundance counts. (b) The
same data but with abundance transformed into a logarithmic simple abundance class measure similar to
that shown in Table 5.1. In plot (b) much of the 'noise' in the data has been removed and the pattern of
plant associations in the two different sedimentary facies is more clearly displayed. (Modifi ed from Spicer
and Hill 1979.)
In the early 1970s Chris Hill excavated three
vertical trenches to obtain contiguous samples
through the Middle Jurassic plant beds at Hasty
Bank, Yorkshire, UK. Sample volumes measured
0.5 m × 0.5 m in area by 0.1-0.2 m depth in
siltstones; where fossils were particularly
abundant in claystones sample size was reduced
to 0.25 × 0.25 × 0.2 m. Within each sample every
single plant fossil was identifi ed and counted. In
subsequent analyses all counts were normalized
to 0.5 × 0.5 × 0.2 m volumes. Analyses were
conducted on the raw counts, logarithmically
transformed counts and using a simple
abundance class measure (Figure 5.13). Results
were analysed by means of histograms and
multivariate statistical analysis. The overall
conclusion was that visually estimating
abundance using a logarithmic scale as in
Section 5.5.2 was more effi cient and meaningful
than absolute counts (Figure 5.13; see also Spicer
and Hill 1979).