Geoscience Reference
In-Depth Information
50
40
30
5
20
10
taxon A
taxon B
2
4
8
16
32
64
quadrat size
(
(
800
600
A
B
400
200
2
4
8
16
32
64
quadrat size
C
block size
(
(
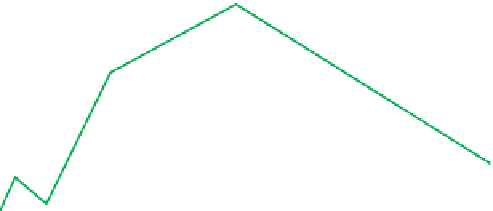
Figure 5.12
(a) The dependence of abundance estimates and, in particular, percentage frequency on the size
of quadrat used in relation to the plant fragment size. If a quadrat of the size shown (small red square) were
used to sample this bedding surface there would be a marked discrepancy in estimated abundance for the two
taxa, irrespective of their actual relative abundance, because the quadrat size is similar to that of one of the
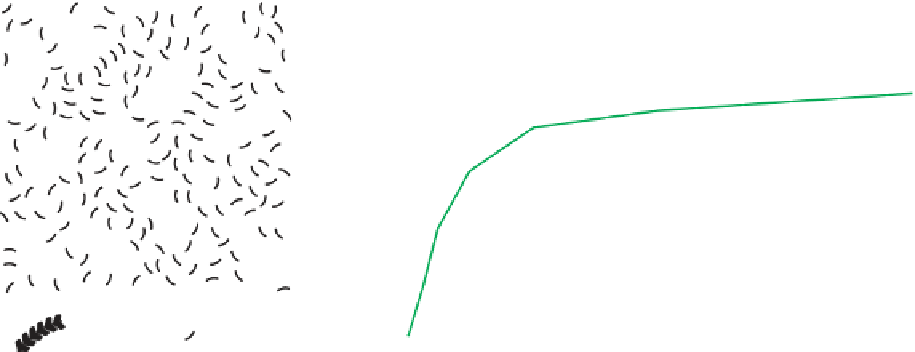
taxa. (b) A rarefaction curve showing increasing numbers of taxa with successive doublings of quadrat size. As
the quadrat size is increased more taxa occur within the quadrat, but above the point where the curve fl attens
out larger quadrat sizes become an ineffi cient way of sampling. The dashed line indicates the minimum quadrat
size for this population, in which something in the order of 34 taxa might be expected to occur within each
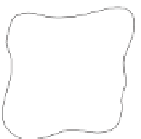
quadrat. (c) Quadrat size in relation to distribution pattern. A-C represent three forms of pattern that a taxon
might exhibit: A, regular; B and C, clumped distributions of different sizes and distribution. In each area the
number of specimens is the same but if a quadrat of the size shown were used for sampling very different
estimates of abundance would be obtained. (d) Detection of contagions (clumping) within an assemblage. If the
quadrat size is increased and the mean square (variance) is plotted, the peaks reveal the scales of clumping.
The situation becomes more complex when several taxa are
involved which, because they may represent parts of the
community or possess similar fl uid dynamics characteristics,
consistently exhibit positive or negative associations
('clumping'). If the exposure allows (e.g. bedding planes