Geoscience Reference
In-Depth Information
immediate interest for climate reconstruction. The presence of such signals is telling
us something much more fundamental about how a given tree species has adapted
to its climatic environment over time. That in itself is worth knowing.
Other forms of emergence in dendrochronology are arguably the effectively
linear association commonly found between tree rings and local climate and the
existence of crossdating itself. It is well known that the physiological processes
and rates of reactions that lead to ring formation are often strongly nonlinear. A
classic example is the nonlinear relationship between net photosynthesis and daily
temperature on rates of primary photosynthesis and dark respiration (Kozlowski
perature than the latter, which results in the roughly quadratic form of the net
photosynthesis curves as a function of temperature. A similar nonlinear relationship
p. 39). Remarkably, the aggregate expression of the many interacting nonlinear, rate-
limited processes within a tree is often an effectively linear response to local climate
(e.g., precipitation and temperature) in its ring widths.
This being said, certain kinds of nonlinearity may be found in tree-ring/climate
relationships when a particular growth-limiting factor such as available soil mois-
ture becomes saturated and tree growth is no longer responsive to it. Consequently,
than linear models in modeling and reconstructing precipitation and drought signals
apparently can be a problem of overfitting using ANNs in relatively low signal-to-
these examples still produced acceptable precipitation reconstructions suggests that
the overall nonlinearity of tree-ring/climate relationships is not large. Vaganov et al.
ear model can in certain cases outperform best-fit linear statistical models when a
change in local climate alters the way in which the trees respond. Such changes in
climate response can also be modeled by using dynamic linear regression modeling
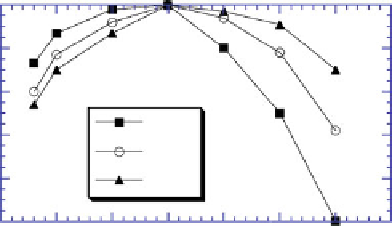
Huon Pine Relative Photosynthesis
as a Function of Temperature
100
80
60
Fig. 4.1
Relative
photosynthesis as a function
of temperature for Huon pine
in Tasmania. Three curves are
basedondifferentinitial
temperature acclimatizations.
Adapted from Read and
8 deg
20 deg
29 deg
40
20
0
5
10
15
20
25
30
35
40
Temperature (°C)