Geoscience Reference
In-Depth Information
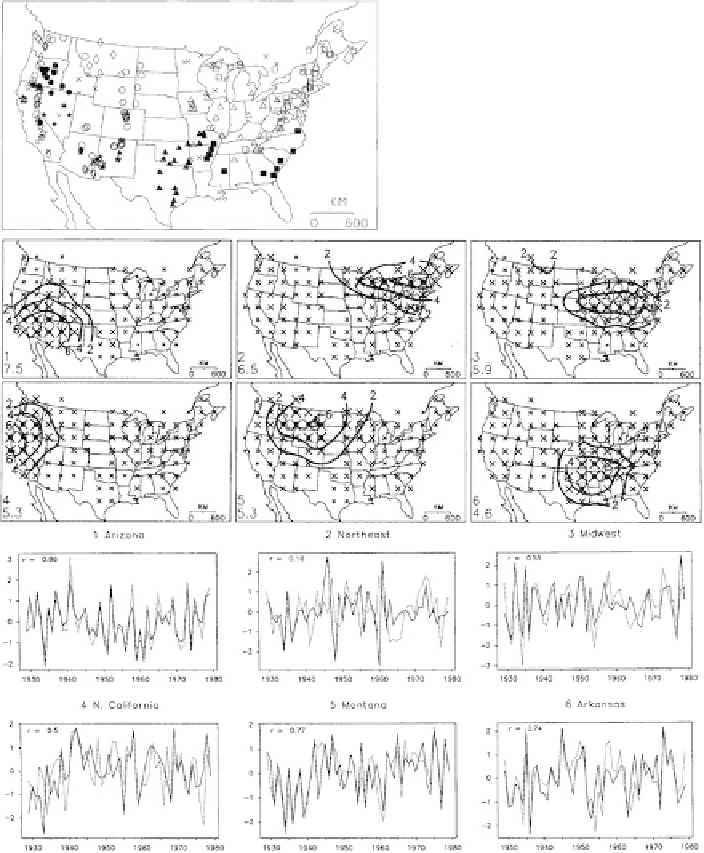
Fig. 2.3
Synoptic-scale patterns of tree-ring growth and their link to climate. Meko et al. (
1993
)
analyzed a network of 248 drought-sensitive tree-ring chronologies using rotated principal com-
ponent analysis (RPCA) 'to delineate “regions” of common tree growth variation in the period
1705-1979.'
Upper panel
: Locations of the chronologies—symbols indicate tree species.
Middle
two rows of panels: Maps of primary pattern coefficients for six of the nine obliquely rotated PCs
of gridded tree-ring indices calculated by Meko et al. Principal component number and sum of
squares of coefficients are shown at the lower left in each panel. In each case, the contoured area
with the larger symbols indicates the region most influencing that PC.
Lower
two rows of panels:
Time series of scores of the six rotated PCs (
solid
) compared with July Palmer Drought Severity
Index (PDSI) (
dashed
) for from 2 to 7 grid points with highest pattern correlation with PC. Both
variables were standardized to zero mean and unit standard deviation. This shows a strong rela-
tionship between large-scale patterns of tree-ring growth and growing season moisture availability
in all regions except the most mesic, the Northeast. Reproduced with permission from Meko et al.