Geoscience Reference
In-Depth Information
all audiences. Alternative ways to describe the long-term records of flow may be
more meaningful. In particular, graphics that showed how often a year like 2002
or a sequence of dry years has occurred were of primary interest. Two examples of
different ways to graphically depict streamflow reconstructions that have been well
Fig. 8.5
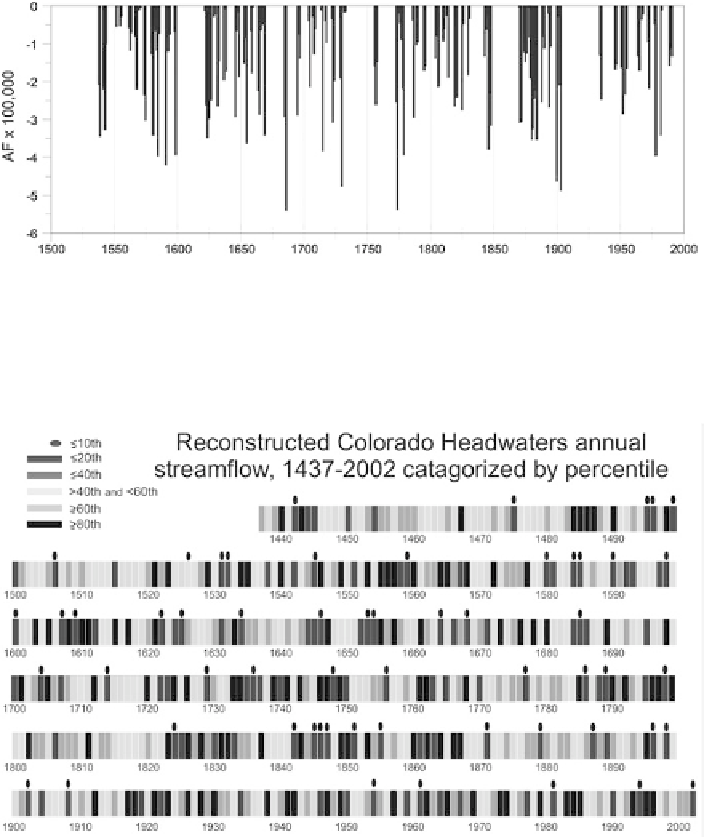
Droughts are not evenly distributed through time. This graph shows periods of drought
in the reconstructed Rio Grande River (Del Norte gauge) annual streamflow, 1536-1999. Only the
years in which 2 or more consecutive years are below the mean are shown, as departures in hundred
thousand acre-feet from the long-term mean
Fig. 8.6
Reconstructed Colorado headwaters streamflow (Blue, Fraser, and Williams Fork Rivers,
averaged). Values are shading-coded according to percentiles of flow. The years with
dots
are the
driest 10% of flows. 2002 was in this category, as were 6 years in the twentieth century. In contrast,
12 extremely dry years occurred in the nineteenth century