Geoscience Reference
In-Depth Information
To proceed with the noise-added reconstruction of Lees-B, 1000 random
sequences of length 509 years were drawn from a normal distribution with mean
zero and standard deviation equal to the cross-validation root-mean-square error
(RMSE
v
) of the reconstruction model. Note that in using RMSE
v
instead of the
standard error of the estimate or the standard error of prediction to compute the
error variances, we are imposing a larger error component than might be suggested
by calibration statistics. The validation error is RMSE
v
=
2337.1 mcm, or about
44% of the standard deviation of the observed flows.
The 1000 noise sequences were each added to Lees-B to get 1000 separate noise-
added reconstructions of length 509 years. Each noise-added reconstruction was
then checked for occurrences of 5 or more consecutive years below the drought
threshold. A count of the number of noise-added reconstructions with a drought
event yields an estimated probability for rejection of the null hypothesis. For exam-
ple, if just one noise-added sequence out of the 1000 generated series has a drought
of at least 5 consecutive years, we can conclude the there is only a 1/1000, or 0.001,
probability that the tree-ring record contains at least one event. In that case we would
clearly reject H0 at the 0.01
-level.
Results revealed that 510 of the noise-added series contained at least one drought
event. The empirical probability that another sequence of 5 or more consecutive
years of low flow occurred before the most recent drought is therefore
p
α
0.51,
indicating that the recent 5-year drought is likely not unprecedented in the long-term
=
Simulation # 7, Event at 1804−1808
5
×
10
4
4
3
2
1
0
−1
1500
1550
1600
1650
1700
1750
1800
1850
1900
1950
2000
× 10
4
Simulation # 256, Events at 1499−1503, 1777−1782, 1879−1883
4
6
5
5
3
2
1
0
1500
1550
1600
1650
1700
1750
1800
1850
1900
1950
2000
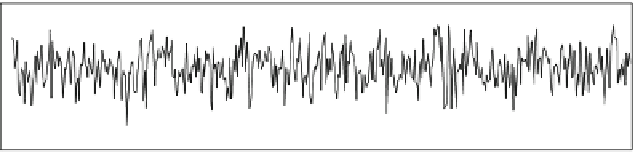
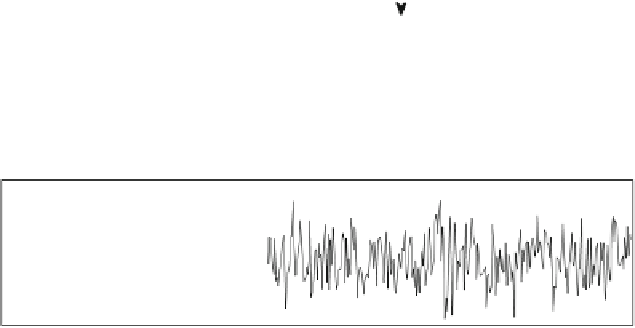
Fig. 8.2
Sample of 2 out of 1000 noise-added reconstructions illustrating occurrence of low-flow
events. A low-flow event is defined as 5 or more consecutive years of flow below the 0.25 quantile
drought threshold of the observed flows, 1906-2004 (
horizontal line
). The simulation at the top
contains a single 5-year run below the threshold and the simulation at the bottom contains two
5-year runs and one 6-year run. A total of 510 of the 1000 simulations had such events