Geoscience Reference
In-Depth Information
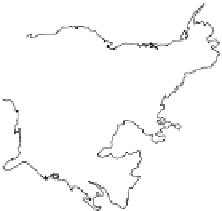
(b)
Regression with difference series (infilled)
4
2
1.6
1.2
0.8
0.4
0.2
0
−
1.5
Fig. 1.2
(
a
) Instrumental temperatures (
heavier line; red in on-line version
) and tree-ring density
reconstructions of temperature (
thinner line; black in on-line version
) averaged over all land grid
boxes north of 50
◦
N, smoothed with a 5-year low-pass filter. (
b
) Map showing where the average
temporal pattern of divergence between tree-ring density chronologies and mean warm season tem-
peratures is most apparent. The smoothed difference between the thin line (
black in on-line version
)
and the thicker line (
red
)in(
a
) were regressed against the local difference curves produced from
the averages of data in each grid box. Where the regression slope coefficients are progressively
>1.0 (the increasingly darker boxes, generally the most northerly locations), the greater is the local
difference between density and temperature. In the areas shown as lighter colored boxes (gener-
ally areas further south), the difference is apparent, but of lower magnitude. The areas shown in
the lightest color (basically the most southern regions) do not show the divergence (redrawn from
Briffa et al. 2004)