Geoscience Reference
In-Depth Information
decrease in correlation between Alaskan and Patagonian records with increasing
southern latitudes.
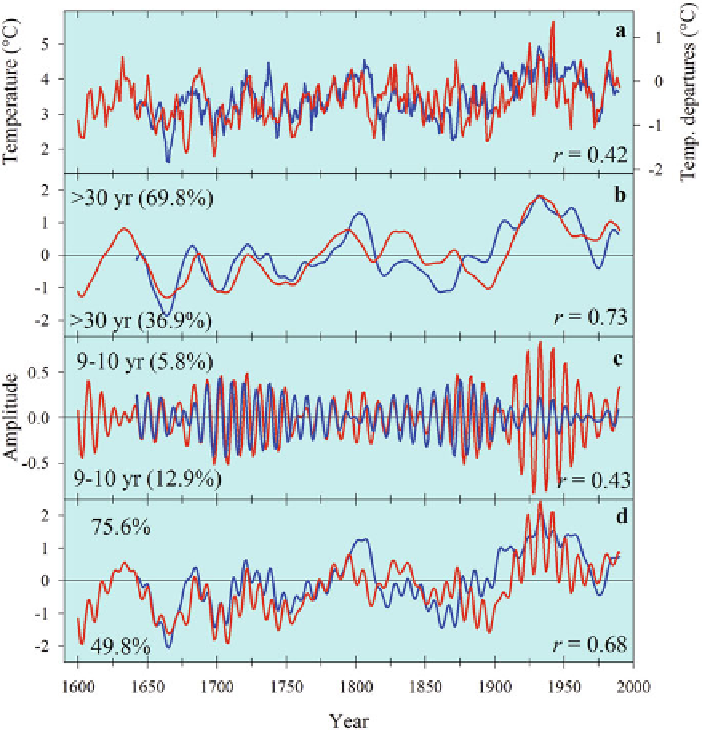
The Gulf of Alaska and northern Patagonia temperature reconstructions are dis-
Fig. 7.6
Comparison of temperature reconstructions from northern Patagonia (
blue line
)and
coastal Alaska (
red line
) and their dominant oscillations isolated by using singular spectrum anal-
> 30 years, and (
c
) 9-10 years. Percentages of the original variance contributed by Patagonian and
Alaskan waveforms are indicated in the upper and lower left corners, respectively. The Pearson's
correlation coefficient,
r
, between the series, is shown in the lower far right. Time series included
in (
d
) represent the sum of the oscillations shown in (
b
)and(
c
)