Geoscience Reference
In-Depth Information
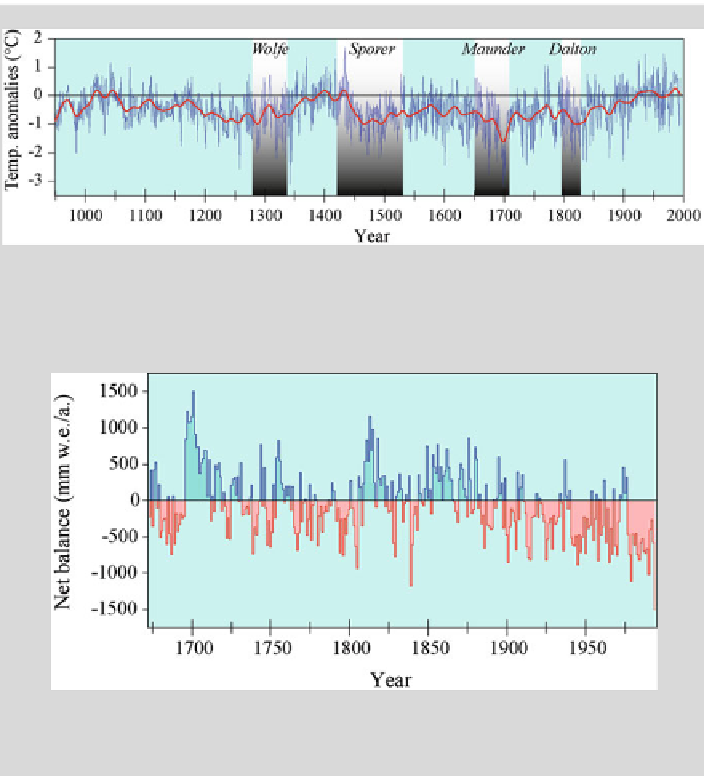
Box Fig. 7.3
Maximum May-August temperatures at the Columbia Icefield, Canadian
Rockies. Temperatures are anomalies based on 1901-1980 means smoothed with a 30-year
Box Fig. 7.4
Reconstructed net mass balance for Peyto Glacier, Alberta 1673-1994
7.3.1.1 Extratropical Pacific Ocean
We use temperature reconstructions from coastal Gulf of Alaska and northern
Patagonia to investigate past changes in the decadal oscillatory modes across the
reconstruction of spring (MAM, March-May) temperature variations, based on
three ring-width chronologies from coastal sites along the Gulf of Alaska, dat-
ing from 1600 to 1988. This reconstruction explains 34% of the variance in the
instrumental temperature data. The decade-long variations in this reconstruction
are consistent with changes in the Aleutian low-pressure system, which in turn
reconstruction shows significant peaks consistent with the ENSO-like bandwidth