Geoscience Reference
In-Depth Information
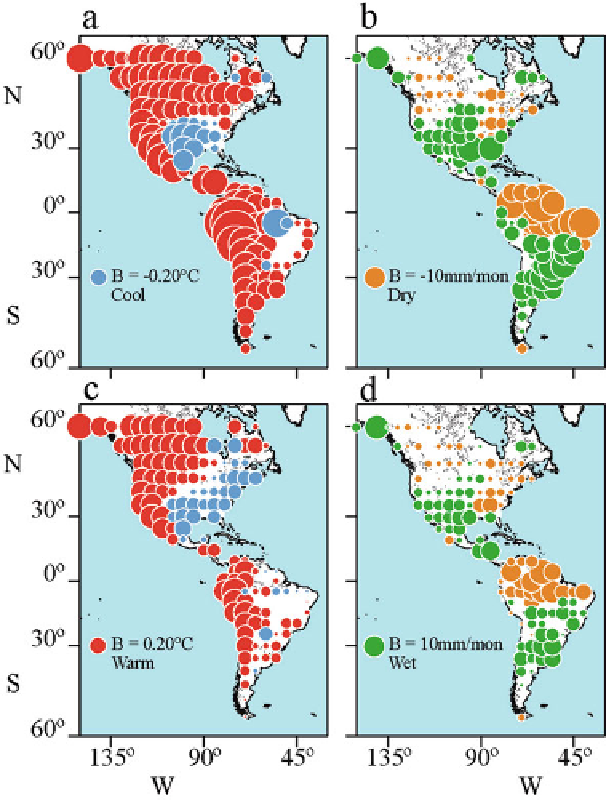
Fig. 7.3
Regression coefficients (B) estimated during the interval 1904-1990, relating Cold
Tongue (CT) index to October-September (
a
) surface air temperatures, and (
b
) precipitation.
Figures (
c
)and(
d
) are same as (
a
)and(
b
) but for the Global Residual (GR) index. Radii of circles
are proportional to the magnitude of regression coefficients:
red
and
light blue
, respectively, for
positive and negative relations with surface air temperatures;
green
and
light brown
, respectively,
for positive and negative relations with precipitation. The
circles
, lower left in each diagram, indi-
cate the scale of influences. Temperatures from an updated version of the monthly, 5
◦
×
5
◦
-gridded
temperature anomaly set of Jones et al. (
1986a
,
b
)
, and land precipitation anomalies on a similar
affected by the magnitude of the variable used in the analysis. The lack of significant regression
coefficients between CT and precipitation in the central Andes along the South American Pacific
coastline is likely due to the reduced precipitation across this region (modified from Dettinger et al.