Geoscience Reference
In-Depth Information
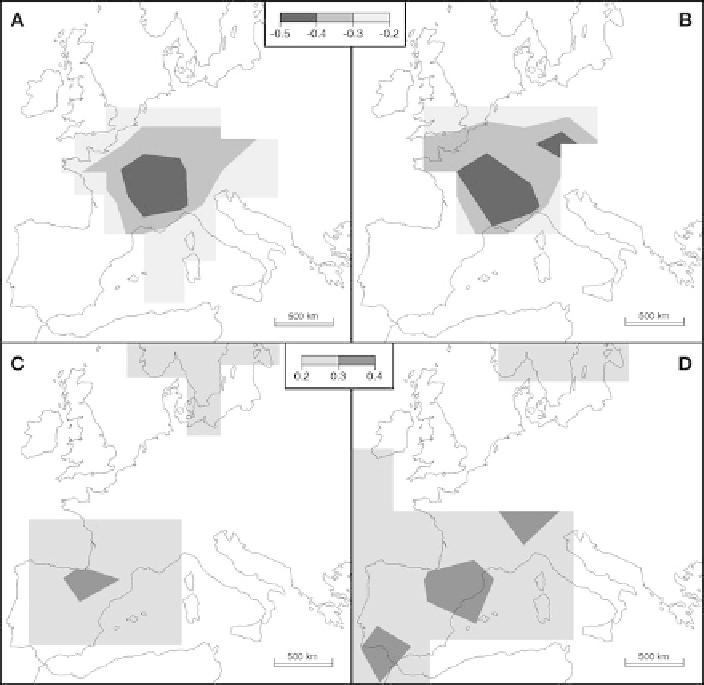
Fig. 6.4
The spatial pattern of correlation with gridded climate data revealed by maximum late-
13
C
14) and latewood
δ
6) from
Pinus sylvestris
and
Pinus uncinata
sampled at Montgenévre (see Gagen et al.
2004
for details). (
a
) Stable carbon
isotopes and June-August precipitation (University of East Anglia, Climatic Research Unit CRU
TS 2.1, 0.5
◦
analysis, precipitation: AD 1901-1995). (
b
) Maximum latewood density and June-
August precipitation (CRU TS 2.1 0.5
◦
analysis, precipitation; AD 1901-1995). (
c
) Stable carbon
isotopes and July-August temperature (AD 1901-2002; CRU TS 2.1 0.5
◦
analysis). (
d
)MXDand
July-August temperature (AD 1901-2002; CRU TS 2.1 0.5
◦
analysis). Spatial field correlations
were performed by using KNMI Climate Explorer
=
series, when correlated with summer precipitation; however, for summer tempera-
tures, the signal is both stronger and more spatially homogenous with the latewood
density series.
It is in situations such as this—where stable isotopes can provide a measure of
a different climatic variable that might be coupled to temperature reconstructions
derived from the traditional tree-ring proxies—that stable isotope dendroclimatol-
ogy has much to offer.