Geoscience Reference
In-Depth Information
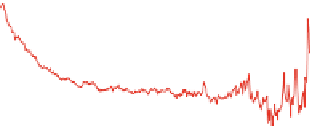
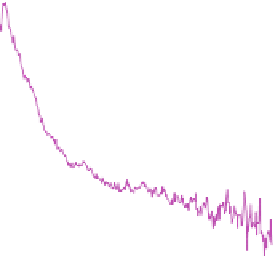
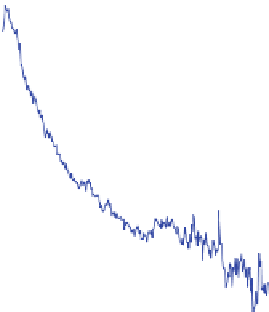
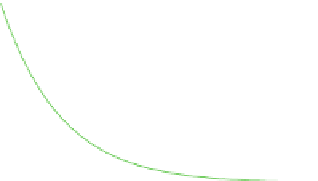
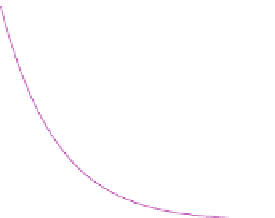
Fig. 5.14
The 1087 ring width measurement series of the Finnish Lapland chronology (Eronen
et al. 2002), without pith-offset estimates, sorted into six growth rate classes (
180 trees in each)
on the basis of the ratio of final tree radius to the radius of the single regional curve standardization
(RCS) curve (at that age) created from all trees Smoothing was achieved by fitting a modified
negative exponential curve to the mean series. (
a
) The mean ring width by age for the six growth
rate classes, slowest to fastest (
shaded
). (
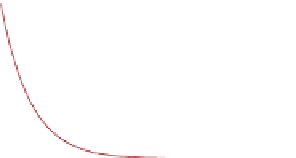
b
) Smoothed RCS curves for each of the six growth rate
classes when fitted first to the full mean ring width by age series (
continuous lines
) and second
when fitted to the portion of these series with sample counts of four or more trees (
dotted lines
)
≈
into six separate classes, each containing 180 or 181 trees. Growth rate was assessed
according to the ratio of the radius of each tree divided by the radius of the single,
overall-sample RCS curve at the point corresponding to the final age of that tree. In
this way, the measurement series for all trees were divided into six groups ranging
from fastest to slowest growth. For each group, a curve of mean ring width by age
was produced and a modified negative exponential curve (5.1) was fitted to each
The low numbers of older samples generally produce large inter-tree variance in
these curves. With few trees (i.e., for tree ages above about 250 years) the measure-
ment averages are erratic, so we have also calculated the curve fits only for sections
of data representing the average of at least four trees. These alternative (truncated
data) curve fits and their associated coefficients are also shown in Fig.
5.14b
and
Table
5.1
(the [at], [bt], and [ct] columns)
These results show that there is potentially large uncertainty in estimating the (b)
coefficient where the RCS curve is fitted over sections of poorly replicated data. In
our truncated group fits, removal of only 0.5% of the ring measurements on average
calculated estimates of concavity for 28 time periods, but based on fewer trees than
in this sample, and there is likely to be considerable uncertainty associated with
them.