Geoscience Reference
In-Depth Information
limitations and allow for these when examining the
possible consequences of climate change.
In 1988 the Intergovernmental Panel on Climate
Change (IPCC) was established by the World Meteoro-
logical Organization and the United Nations Environment
Programme and given a daunting task. Its objective was
to assess, on a comprehensive, objective and open basis,
the scientific, technical and socio-economic information
relevant to understanding the scientific basis of risk of
human-induced climate change, its potential impacts
and options for adaptation and mitigation. It does not
organize research in its own name, but relies on literature
in research papers that have been reviewed by fellow
experts. The various working groups within the panel try
to synthesize the information so obtained in order to
establish what is, arguably, the consensus of opinion on
the above aspects of climate change. If we can explain the
current measured variations of climate through our
models, it is argued, we can predict a climate
scenario
of
what the climate might be 100 years hence on the basis of
expected changes in the factors forcing climate such as
greenhouse gases and solar radiation variation (
Figure
28.1
).
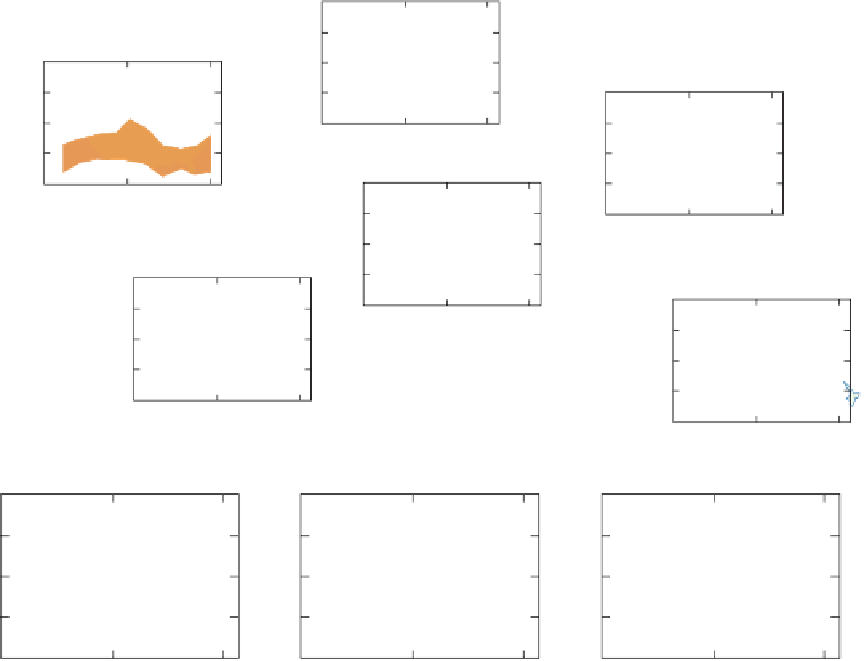
In
Figure 28.1
we can see the similarity between
observed trends of temperature between 1900 and 2000
Europe
1.0
North America
0.5
Asia
1.0
0.0
0.5
1.0
1900
1950
2000
Year
0.0
0.5
Africa
0.0
1900
1950
2000
Year
1.0
1900
1950
2000
Year
0.5
South America
0.0
Australia
1.0
1900
1950
2000
Year
1.0
0.5
0.5
0.0
0.0
1900
1950
2000
Year
1900
1950
2000
Year
Global
Global Land
Global Ocean
1.0
1.0
1.0
0.5
0.5
0.5
0.0
0.0
0.0
1900
1950
2000
1900
1950
2000
1900
1950
2000
Year
Year
Year
Models using only natural forcing
Models using both natural and anthropogenic forcing
Observations
Figure 28.1
Comparison of observed continental- and global-scale changes in surface temperature with results simulated by
(black line) plotted against the centre of the decade and relative to the corresponding average for 1901-1950. Lines are dashed
where spatial coverage is less than 50 per cent. Orange and purple shaded bands show the 5-95 per cent range for 58 simulations
from 14 climate models.
Source: IPCC 2007