Geoscience Reference
In-Depth Information
the tropics polewards, otherwise the tropics would get
hotter and polar regions cooler. It is the winds of the
world, and to a lesser extent the ocean currents, which
bring about the necessary heat transfer.
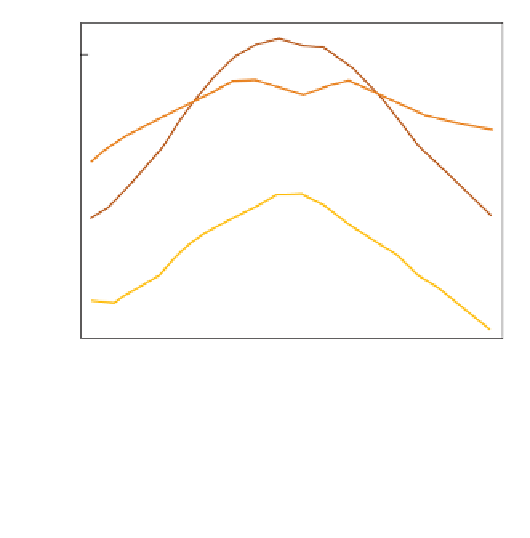
To see how much radiant energy we have available at any
location we must know how much radiation is being
lost as well as how much is reaching that location. Long-
wave radiation emission is proportional to the absolute
temperature of the surface. It is far less variable than the
input of solar radiation. The difference between incoming
and outgoing radiation is known as net radiation or the
radiation balance. For Earth's surface, estimates are shown
in
Figure 3.7
.
If we include the effects of the atmosphere, the picture
changes. The atmosphere has a negative balance, even in
the tropics (
Figure 3.8
).
In fact, values differ little between
equator and poles. For any particular latitude, we can sum
the surface and atmospheric radiation balances to find out
which areas of Earth have a radiation surplus and which
areas have a deficit. Using satellite data, it is now possible
to determine the radiation balance of the surface and
atmosphere together, as shown in
Figure 3.9
.
In general
there is a surplus of energy between about 38
350
300
Absorbed Solar
250
Emitted Longwave
200
150
100
Net Radiation
50
0
-50
-100
-150
-90
-60
-30
0
30
60
90
Latitude
S
and a deficit towards the poles. Naturally the magnitude
of the surplus is identical to that of the deficit, but it does
mean that there must be a steady transfer of energy from
N and 38
long-wave radiation and net radiation averaged around latitude
circles.
Source: After Hartmann (1994)
LONGITUDE
150
120
90
60
30
0
30
60
90
120
150
180
80
80
25
25
60
25
50
50
50
50
75
50
50
40
40
75
75
75
100
75
100
100
75
75
125
125
125
150
20
150
20
100
100
75
100
125
100
150
150
75
125
150
150
0
125
0
100
150
150
125
175
100
100
75
20
125
125
100
20
125
125
125
75
100
100
75
100
75
75
40
40
75
50
50
50
60
60
90
60
30
0
30
60
90
150
120
120
150
180
Source: After Budyko et al. (1962)