Geoscience Reference
In-Depth Information
Atmospheric dust and its impact
HUMAN IMPACT
Dust in the atmosphere can scatter and absorb solar radiation as well as strongly absorbing long-wave radiation.
Although this is a natural component of the atmosphere, as a result of human activities the amount of atmospheric
dust has increased, with a potential effect on the radiation budget and other aspects of the environment. Much of
this increase in dust comes from land use changes when forests are cleared for agriculture, exposing bare soil,
and when natural vegetation declines in abundance through overgrazing. Plumes of dust can be seen in satellite
imagery, from which estimates can be made of their impact on Earth's radiation budget; the highest values amount
to only a few watts per square metre, so the direct effects are not large. Large amounts of dust are deposited in
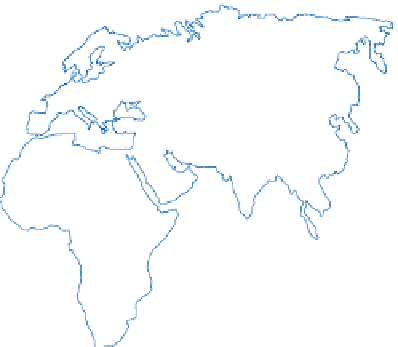
the oceans on the leeward side of dry lands such as the Atlantic Ocean off the Sahara, the Indian Ocean off Arabia
and the eastern Pacific off China (
Figure 26.11
).
At Nouakchott, on the coast of Mauritania, dust storms blew, on
average, ten days per year in the relatively moist 1960s. In the mid-1980s, after over twenty years of below-average
rainfall, the average had risen to eighty days per year. Assuming each storm carried a similar amount of dust,
it represents a large increase in material transport into the Atlantic. This material has been extracted from
oceanic cores even as far west as the Caribbean. Research has indicated that the volumes of dust blown off the
Asian continent into the Pacific Ocean are increasing the intensity of cyclonic storms in that area and helping in
the transfer of heat and moisture polewards. This will have the effect of increasing polar ice and permafrost
melting. Conversely the amounts of dust blowing off the Saharan into the tropical Atlantic are inversely related to
the number of hurricanes.
LONGITUDE
150
120
90
60
30
0
30
60
90
120
150
180
80
80
60
.D]DNKVWDQ
6RXWKHUQ
*UHDW3ODLQV
40
40
*REL
$UDELDQ
20
20
6DKDUD
0
0
.DODKDUL
20
20
3DPSDV
6LPSVRQ
Main dust trajectories
40
Tonnes per km
2
yr
-1
0.1 - 1
1 - 10
>10
60
150
120
90
60
30
0
30
60
90
120
150
180


