Geoscience Reference
In-Depth Information
LONGITUDE
LONGITUDE
120
60
0
60
120
180
120
60
0
60
120
180
80
80
80
80
(a)
(b)
60
60
60
60
40
40
40
40
20
20
20
20
0
0
0
0
20
20
20
20
40
40
40
40
60
60
60
60
120
60
0
60
120
180
120
60
0
60
120
180
50
100
150
200
250
300
50
100
150
200
250
300
LONGITUDE
LONGITUDE
120
60
0
60
120
180
120
60
0
60
120
180
80
80
80
80
(c)
(d)
60
60
60
60
40
40
40
40
20
20
20
20
0
0
0
0
20
20
20
20
40
40
40
40
60
60
60
60
60
0
60
60
0
60
120
120
180
120
120
180
50
100
150
200
250
300
50
100
150
200
250
300
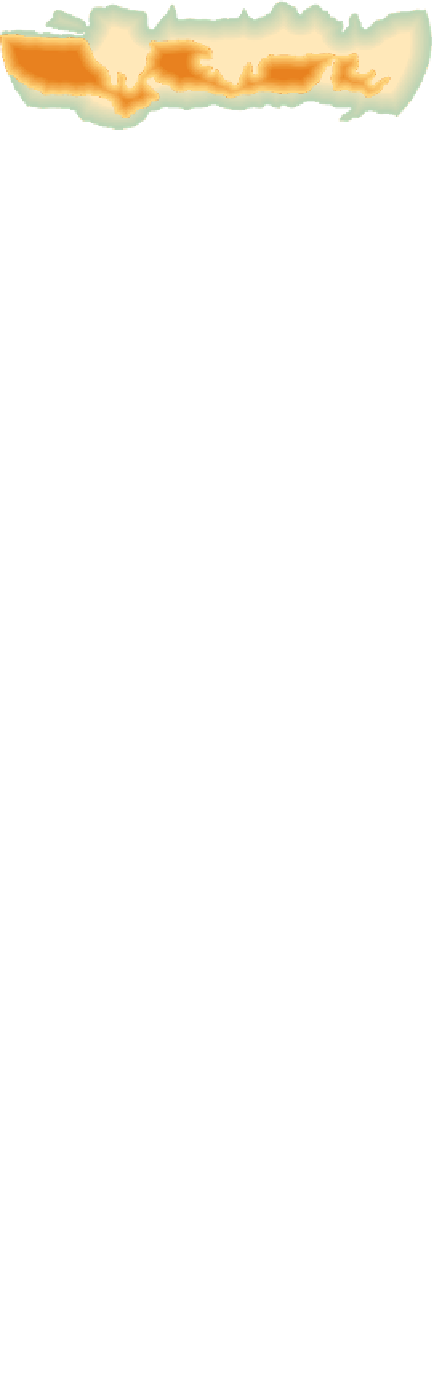
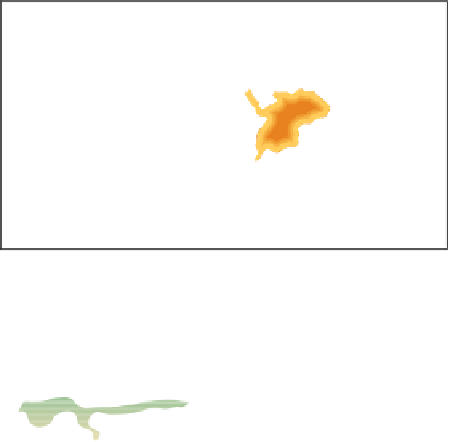
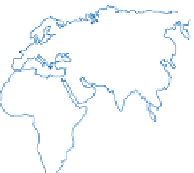
Figure 3.3
Long-term (1984-97) average global distribution of net downward (or absorbed) shortwave radiation (W m
-2
) at the
Earth's surface for the mid-seasonal months of (a) January, (b) April, (c) July and (d) October.
Source: After Hatzianastassiou et al. (2005)
at the surface). When reflected, the radiation is returned
to space in the short-wave form and becomes part of
the outflow of energy from Earth. Similarly, some of the
scattered radiation is returned to space to give a short-
wave albedo for our planet of 28 per cent. The modifica-
tions of the solar beam by the atmosphere are shown
diagrammatically on the left-hand side of
Figure 3.2
.
will take place. Clouds are also very effective at absorbing
long-wave radiation and hence their temperature will be
higher than otherwise. This cloud effect is most noticeable
at night. With clear skies and dry air, long-wave radiation
0HDQ
Long-wave radiation
All substances emit long-wave radiation in proportion to
their absolute temperature. Earth's surface absorbs most
short-wave radiation and therefore normally has a higher
temperature than the atmosphere. It follows that more
long-wave emission will be from the ground surface. The
atmosphere is much more absorbent of long-wave
radiation than of short-wave radiation. Carbon dioxide
and water vapour are very effective absorbers of much of
the longer part of the spectrum except between 8 μm and
12 μm. As water vapour is concentrated in the lowest
layers of the atmosphere, that is where most absorption
$XJXVW
6HSWHPEHU 2FWREHU 1RYHPEHU 'HF
Figure 3.4
Average area of the Antarctic ozone hole (mea-
Source: Climate Prediction Centre, NOAA, 2006