Geoscience Reference
In-Depth Information
4
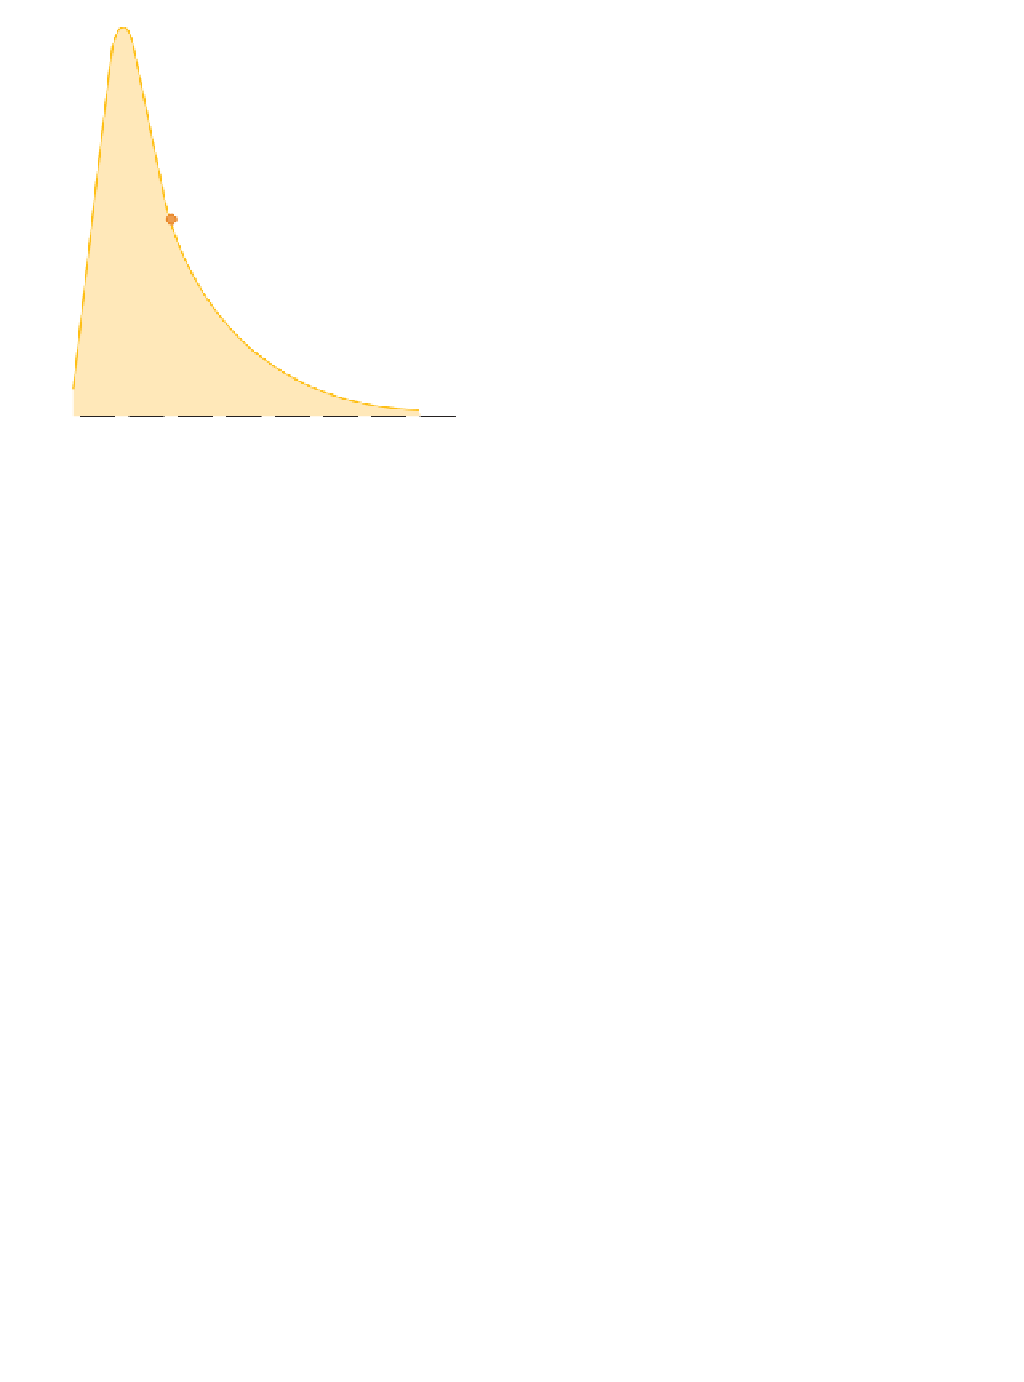
200 mm ka
-1
3
100 mm ka
-1
2
Initial
uplift
50 mm ka
-1
1
25 mm ka
-1
12.5 mm ka
-1
6 mm ka
-1
0
0 0 0 0 0 0 0 0
Elapsed time, Ma
Plate 13.2
Half Dome (2,693 m OD), part of the Sierra
Nevada granite batholith exhumed during the later Cenozoic,
whose near-vertical rock wall overhangs Yosemite Valley by
Photo: Ken Addison
see text for explanation.
Source: After Strahler and Strahler (1978)
Thereafter, from time zero, the net rate of lowering
declines in exact proportion to the remaining relief.
Denudation rates therefore decay exponentially. Fifty per
cent of initial elevation is lost in the first 10 Ma but only
25 per cent more by 20 Ma. About 3 per cent survives
50 Ma. This example assumes a constant humid climate
with active fluvial and/or glacial erosion and no
rejuvenation
or new uplift, otherwise rates will change.
Isolated higher peaks mark localized enhanced uplift, or
immature connection with steep slope/valley systems
where denudation is concentrated. The latter exerts
general influence on height. Erosion takes longer to reach
summits in broader orogenic belts such as the greater
Himalayas. This may explain why its peaks are 1 km
higher than anywhere else and the young Tibetan plateau
is so far poorly dissected. Quaternary glaciation also
undoubtedly played a major role, creating what have been
called 'climate-carved' mountains from broad, high
plateaux.
Plate 13.2
illustrates both the impact of glacia-
tion, and the extent of denudation, in the exposure of the
Sierra Nevada granite batholith.
Denudation rates
per se
are measured as sediment
transfers by rivers or sediment fluxes to transient lakes or
marine basins. Measurements come in various forms,
from t km
-1
yr
-1
or kg m
-2
yr
-1
(suspended stream load),
ppm concentration or electrical conductivity (dissolved
load) to mm yr
-1
(thickness) or km
3
yr
-1
(volume) of
accumulating sediment. They are converted into
average
surface lowering
rates, or rock wall retreat on slopes, in
mm yr
-1
, assuming mean continental rock density of 2·7
g cm
-3
. This is unsatisfactory, because it does not equate
easily with our perception of landscape dissection and the
creation of relative relief by erosion concentrated in
valleys. It is a consistent standard, however, and is directly
comparable to uplift rates. More important caveats
concern the short time scales and other uncertainties of
measuring terrestrial processes. Sediments in transit at one
point of measurement may be detained elsewhere. This is
pertinent, for example, in the Karakoram and New
Zealand's Southern Alps, where river terrace sediments
can be uplifted and recycled before reaching the coast!
Dissolved rock is more difficult to track, and biogenic
processes extract minerals from one part of the sediment
cascade and redeposit them elsewhere later. Sediment
loads in northern Europe may be more indicative of the
easier reworking of Pleistocene glacial sediments than
of current lowering. The restless state of Quaternary
environments, the emergence of hominids and increasing
anthropogenic
impact complicate assessments of long-
term rates. Only deep-ocean undisturbed terrigenous
sedimentation produces reliable figures (of approximately
10 m Ma
-1
) over long, radiometrically secure time scales.
Nevertheless, some gross figures are available. An average
of recent estimates suggests that 25-28
10
9
t yr
-1
of
terrigenous sediment is delivered to the oceans, in a solid
: dissolved ratio of 6 : 1. This is equivalent to 62-70 mm
ka
-1
of surface lowering. Allowing for isostatic recovery,
net lowering of terrestrial surfaces amounts to 12-14 mm