Geoscience Reference
In-Depth Information
LONGITUDE
60°
120°
180°
120°
60°
0°
80°
80°
Polar upwelling
Equatorial upwelling
Coastal upwelling
34
32
35
60°
60°
32
33
36
40°
40°
34
35
37
20°
20°
36
34
35
35
0°
0°
36
35
37
20°
20°
36
36
35
40°
40°
35
35
34
60°
34
60°
60°
120°
180°
120°
60°
0°
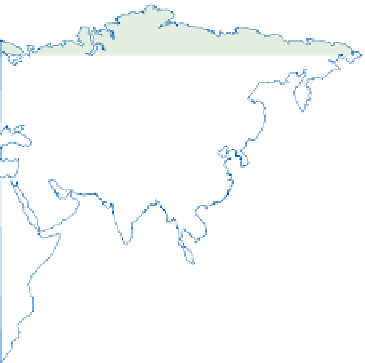
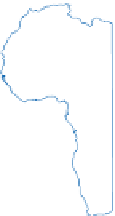
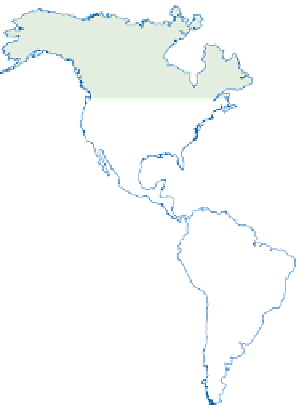
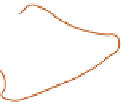
Figure 11.9
The mean annual distribution of surface salinity and principal zones of ocean upwelling. The lines connecting points
of equal salinity are isohalines, in parts per thousand.
Source: Lalli and Parsons (1997)
(a)
(b)
(c)
10
30
50
1.023
1.024
1.025
0
10
2
0
Photic zone
Photic zone
1
1
Thermocline
Halocline
Pycnocline
km
2
km
2
3
3
4
4
10
30
50
1.023
1.024
1.025
0
10
20
Salinity, ‰
Density, g cm
-3
Temperature, °C
Figure 11.10
Vertical stratification of the ocean with respect to (a) salinity, (b) density and (c) temperature. Salinity may rise
rapidly towards the surface in low-latitude bays (strong evaporation) and temperature may fall towards the surface near
freshwater and glacial inflow. Depth in kilometres.
Source: Modified from Gross (1990)