Geoscience Reference
In-Depth Information
Ocean
Area
% global
% Earth's
Volume
Mass
Density
Mean
(10
6
km
2
)
ocean
surface
(10
6
km
3
)
(10
23
kg)
(g cm
-3
)
depth (km)
Atlantic 94·3 24·9 17·7 340·3 3·5 >1·03 3·57
Arctic 12·2 0·9 0·6 13·7 0·13 ~1·03 1·17
Indian 74·1 21·1 14·9 286·7 3·0 ~1·03 3·84
Pacific 181·3 53·1 37·6 717·8 7·4 <1·03 3·94
Global 361·9 100·0 70·8 1,358·5 14·03 1·03 3·73
Note: The southern ocean is counted into the southern areas of the three main oceans; the figures include all epicontinental seas, included with
the most appropriate ocean.
between coupled stores. Thermal expansion would raise
sea level by approximately 0·8 m for a 1
C rise in global
temperature before any ice melts. Changes in atmospheric
pressure also create measurable changes in sea height,
falling in anticyclonic (high-pressure) and rising in
cyclonic (low-pressure) conditions at the rate of about
1 cm hPa
-1
. The ocean-lithosphere couple, which cycles
water through oceanic crust via subduction and hydro-
thermal circulation, is assumed to be in equilibrium -
partly because it is difficult to assess!
We have a better grasp of ocean-atmosphere-cryos-
phere coupling and its component terrestrial hydrological
cycle. Intermediate-term instability is associated with the
growth and decay of Quaternary ice sheets which form the
bulk of the planetary
cryosphere
(ice-bound systems).
Evaporated ocean water stored in terrestrial glaciers
during a cold stage causes a eustatic
fall
in sea level
(
Plate 11.2
).
Deglaciation causes a
rise
, corresponding to
the water-equivalent ice mass melted and returned to the
oceans. The most recent glacial/interglacial cycle of
the past 125 ka experienced eustatic changes of about
± 130-165 m. Modern sea level will rise by a further
60-80 m if the remaining ice sheets melt, with major
coastline implications. The rate of change can be rapid,
with a rise from -130 m to -60 m from 15,000 to 9,000
radiometric years
BP
(using
AD
1950 as the index year) and
exceeding 20 m ka
-1
during catastrophic ice sheet collapse
c
. 12,500
BP
. Sea ice formation/melt has a negligible
eustatic effect, since it replaces virtually its own volume
of water.
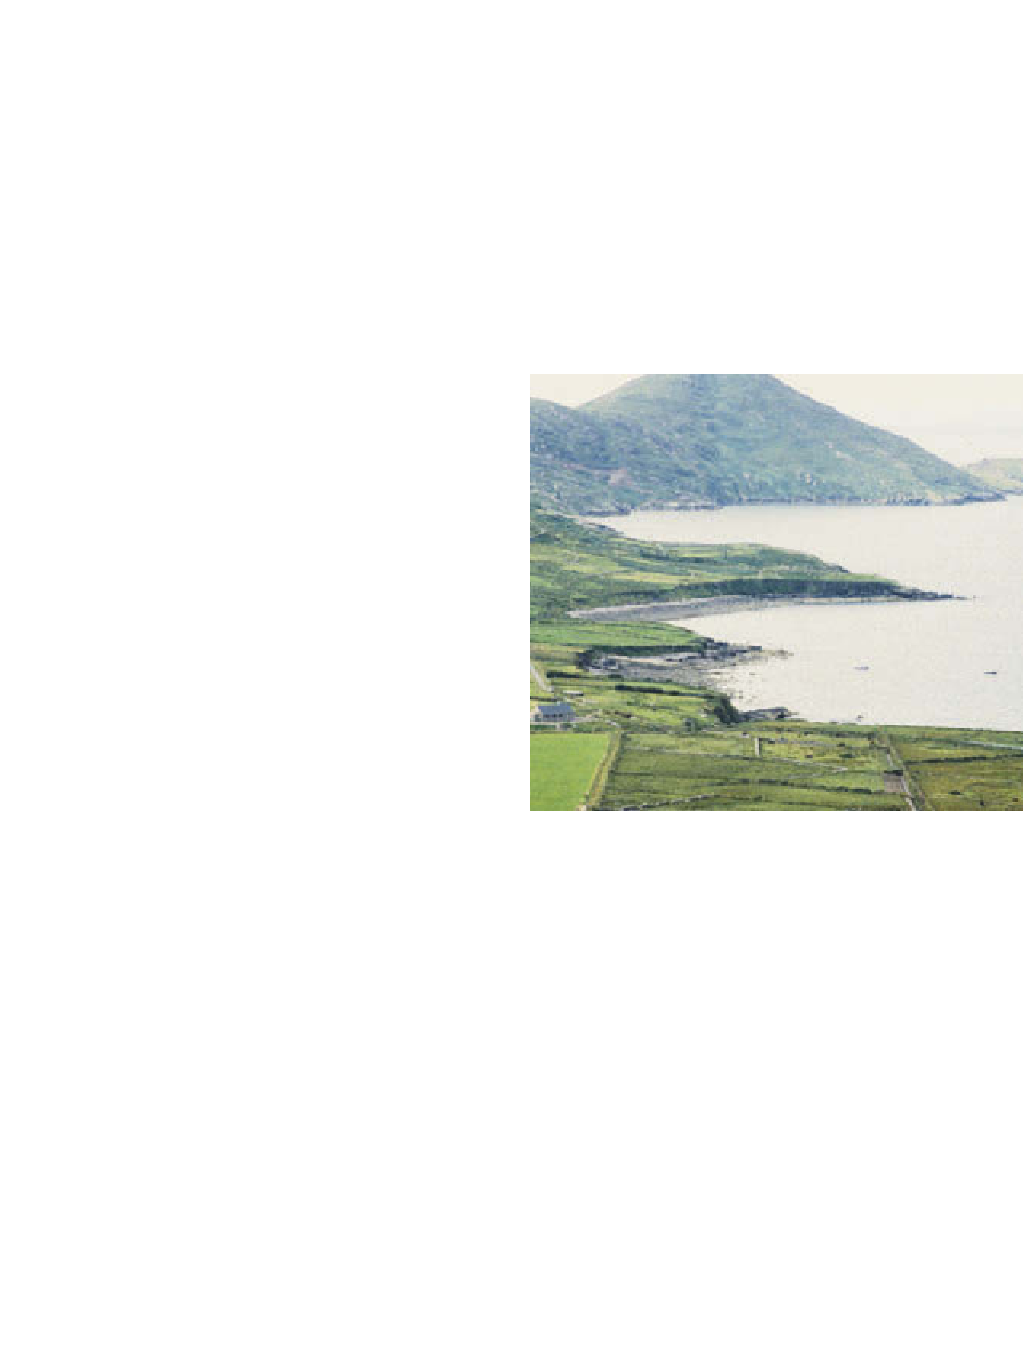
to isostatic and eustatic processes during the Quaternary.
Raised, marine wave-cut platforms are visible here on the
Atlantic coast of Kerry, Ireland.
Photo: Ken Addison
thin, dense oceanic lithosphere 'floats' lower than thicker,
less dense continental lithosphere, hinted at by the
bimodal ('twin peak') nature of the hypsometric curve.
Either form of crust can also be loaded/unloaded by the
addition or removal of water, ice, rock mass or sediment,
causing isostatic depression or uplift. Response is more
complicated than eustatic change, since it depends on flow
or
creep
of ductile crust. This is both slow and, by its
nature, extends beyond the exact area of load change.
Although far from instantaneous and worldwide, it does
alter ocean basin geometry.
Flexural isostasy
due to
lithosphere creep away from or towards the increase/
decrease in load causes
fore-bulge
or
downwarp
beyond its
margins (
Figure 11.7
).
Isostatic control of sea level
Isostasy is the gravitational equilibrium between crustal
lithosphere of different thickness/density, and therefore
'buoyancy', through vertical or lateral adjustments in
adjacent lithosphere. At the largest scale this explains why