Geoscience Reference
In-Depth Information
In south-eastern Australia and New Zealand, by 2000
BP
conditions had become cooler and drier than during
the Holocene Climatic Optimum but in Queensland it
was still as warm. Neither the Medieval Warm Period nor
the Little Ice Age has been identified conclusively in the
low and middle latitudes of the southern hemisphere.
However, cores from Antarctica show signs of warming
from around
AD
300 to
AD
1000, and a Medieval Warm
Period about
AD
1500 and a Little Ice Age in the 1800s
have been claimed. In such situations it is not clear
whether they represent marked climatic variability in time
and space compared with the present or whether the
nature of evidence used and its interpretation is suspect.
Clearly it is an area where further research is needed.
upland Languedoc in southern France there were food
shortages and famines associated with severe winters and
wet summers. In Spain agricultural difficulties arose
through increased aridity and temperature variability.
Globally the extent of snow and ice on land and sea seems
to have reached its highest levels since the Loch Lomond
stadial period, though the timing of its culmination varies.
It appears to have been earlier in the United States than
in Europe or the southern hemisphere, whilst in China the
coldest periods were around 1700 and 1875. Much of the
evidence for cooling is based on ice advances. However, it
is the combination of temperature and precipitation as
well as the 'response time' of the glacier which determines
advances rather than temperature alone.
As a result of many studies of this period around the
world it is clear that there was not a continuously cold
period from the sixteenth century to the nineteenth.
Only a few cold periods appear to have been synchronous
on a hemispheric or global scale. The coldest episodes in
one region do not correspond with those of other regions.
The term 'Little Ice Age' should be used with caution.
Little Ice Age
The commencement of the Little Ice Age has been the
subject of much debate. Recent work suggests that glacial
advances in the Swiss Alps starting in the thirteenth
century and reaching an initial culmination in the four-
teenth century indicate the commencement of cooling.
Locations around the North Atlantic confirm this approx-
imate starting point. It was not a steady deterioration but
involved many fluctations, with a decreasing temperature
trend. After the 1590s growing seasons returned to more
normal values, though cold winters remained frequent.
The Little Ice Age is the first period in which instrumental
observations can be used to measure climate change.
In central England the mean annual temperature in the
1690s was only 8·1
Present climate
By the middle of the nineteenth century the effects of the
Little Ice Age were waning in most parts of the world and
we begin the steady warming of the last century. The first
1860
1880
1900
1920
1940
1960
1980
2000
C below the current
figure. Agriculture in upland areas became more difficult
as the growing season shortened, leading to the abandon-
ment of many farms, whose land often reverted to
moorland or rough grazing. An added problem during
this period of cooler temperatures appears to have been
enhanced variability of temperature. It was not merely a
swing from one year to another but a period of several
successive years with similar temperatures and precipita-
tion before a change to a period of a markedly different
character. For example, the poor summers of the 1810s
contrasted strongly with the hot ones of the late 1770s,
the early 1780s and around 1800. Other parts of Europe
were also affected. Records by Dutch merchants of canal
freezing and trade interruption show a high frequency of
such events between 1634 and 1700, with the 1690s being
particularly severe. Glaciers advanced in the Alps, though
close examination of readvances show that they were not
always synchronous from region to region or even from
one valley to another in the same region. Elsewhere, farms
had to be abandoned in Iceland and Scandinavia; in
C - almost 2·1
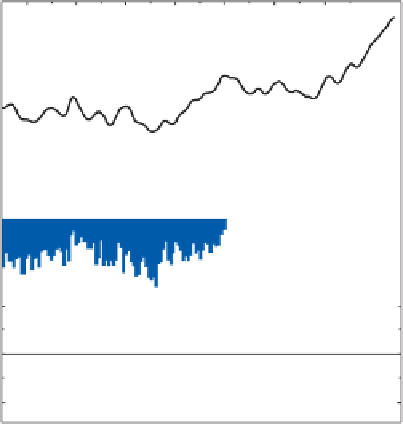
Northern hemisphere
0.5
0.0
-0.5
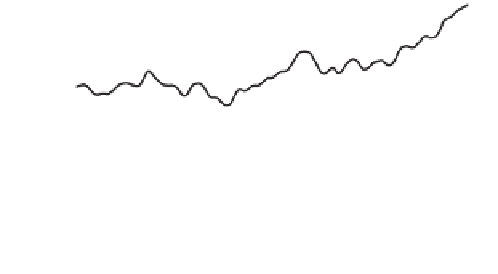
Southern hemisphere
0.5
0.0
-0.5
Global
0.5
0.0
-0.5
1860
1880
1900
1920
1940
1960
1980
2000
the 1961-90 average for combined land and marine records
for the globe, 1850-2006. Smooth curve is a ten-year filter.
Source: Climatic Research Unit website