Geoscience Reference
In-Depth Information
Night
Day
(a)
20
Calm
Windy
15
10
5
Temperature
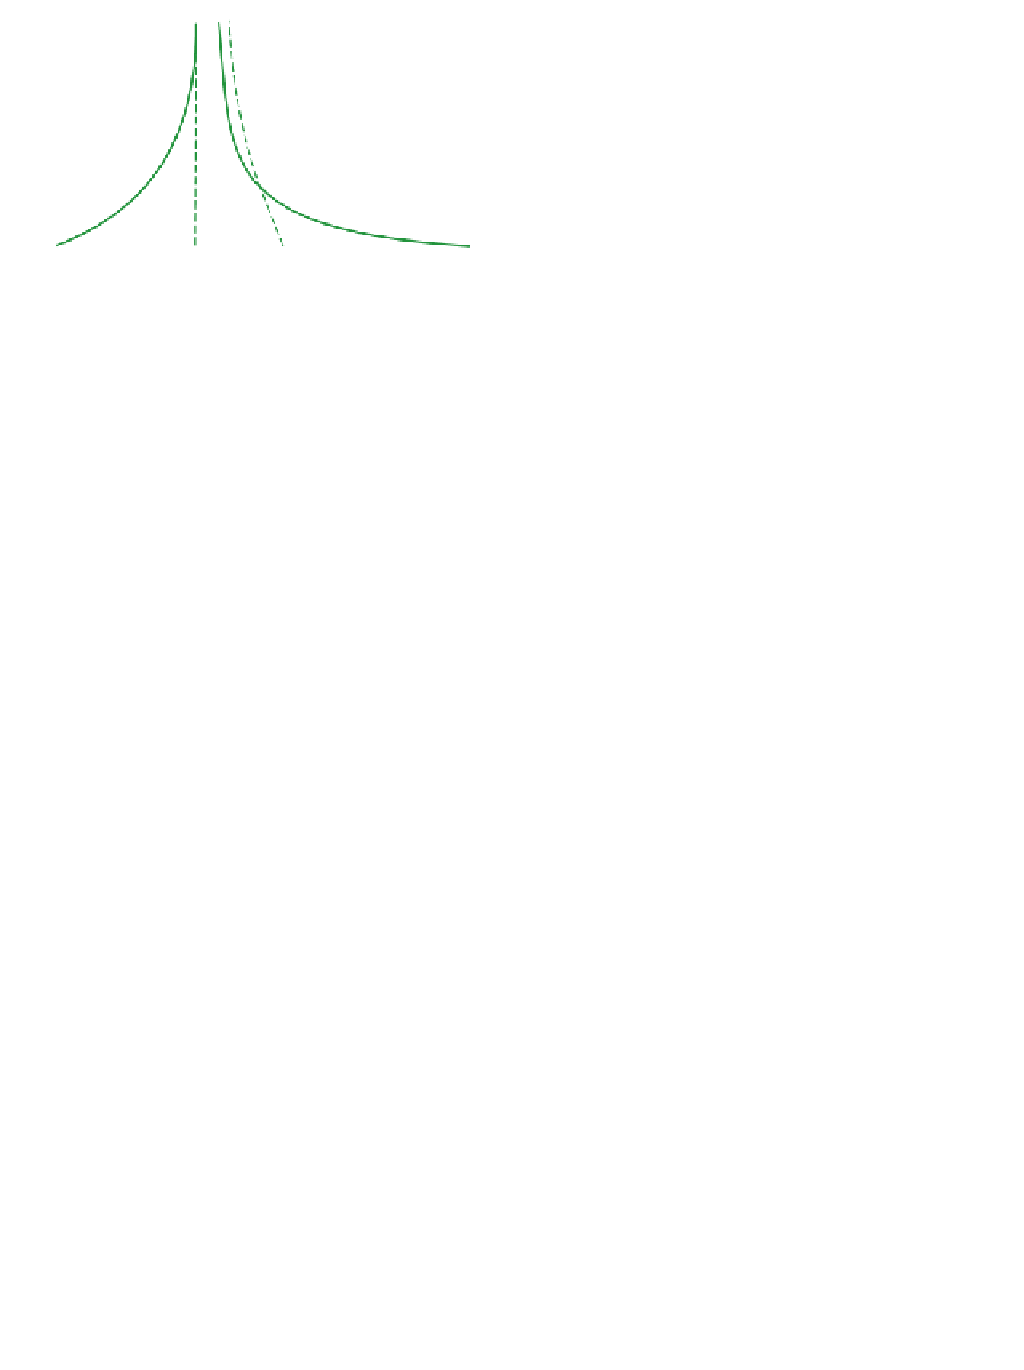
Figure 8.2
Daytime and night-time temperature profiles on
windy and calm days with clear skies.
0
(b)
10
5
Radiation balance at night
At night the net radiation at the ground surface is negative.
More long-wave radiation is lost from the ground than is
returned as counter-radiation from the atmosphere. This
is especially true with clear skies and dry air, which allow
the long-wave radiation to escape to space more easily. In
cloudy or humid conditions heat loss is less effective, for
water vapour readily absorbs long-wave radiation and re-
emits it towards the ground. During the night, therefore,
the surface normally gets cooler, although heat may flow
up from lower levels in the soil to reduce the cooling effect
of radiation loss. In a sandy soil, with its large air spaces,
this process is limited, so the surface becomes particularly
cool, as anyone who has slept outdoors on beach sand will
know. The air in contact with the ground also gets cooler,
making the air denser, and an inversion of temperature
will develop.
The night-time profile of temperature during calm
conditions is shown in
Figure 8.2
,
which illustrates the
major cooling at the surface. If conditions are windy the
cooler air will be mixed with the warmer air above, so
there may be little temperature change with height. Clouds
are efficient emitters or radiators of long-wave radiation,
so low clouds encourage counter-radiation to the surface
and the net loss of energy from the surface is reduced. On
cloudy and windy nights the cooling at the surface is
small and temperatures decrease away from the surface.
The factors most favouring low surface temperatures at
night are consequently clear skies, dry air, no wind, and
sandy soil, dry peat or a snow-covered surface. If such
conditions occur at the beginning of the growing season
in most temperate latitudes then damage to frost-sensitive
crops is likely.
1.0
0.5
0.1
0.05
0.01
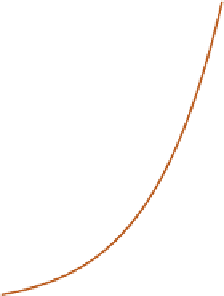
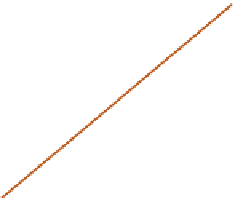
Wind speed
precise shape of the curve will depend upon the roughness of
the surface as well as any buoyancy. (b) Another profile plotted
in a semi-logarithmic form, with the height axis converted to
the natural logarithm of the value. Both graphs are shown
dashed as the surface is approached because of the difficulty
of measuring speed close to the ground.
(
Figure 8.3
).
This is largely due to the frictional drag
exerted on the air by the underlying rigid surface; the
rougher the surface is, the more it slows the air down (see
Chapter 16).
Over a soil surface the effect on the wind is
fairly simple, but when we are dealing with a vegetation
layer or an urban area, interference is much greater. In
addition to friction, buoyancy in the lower layers has an
effect on the details of the profile. Rising air will increase
mixing and reduce the gradient of wind speed.
The
microclimate
at a soil surface represents one of the
simplest cases of energy exchange at the ground. Both
the inputs and the outputs of radiation are changed, and
that alters the way energy is used in terms of sensible and
latent heat, and heat flow or storage into the soil. This is
illustrated in
Figure 8.4
,
where the energy balances over
a wet and a dry soil, as found in a desert oasis, are
Wind near the ground
As we approach the ground, wind speed decreases very
rapidly to almost zero in contact with the soil surface